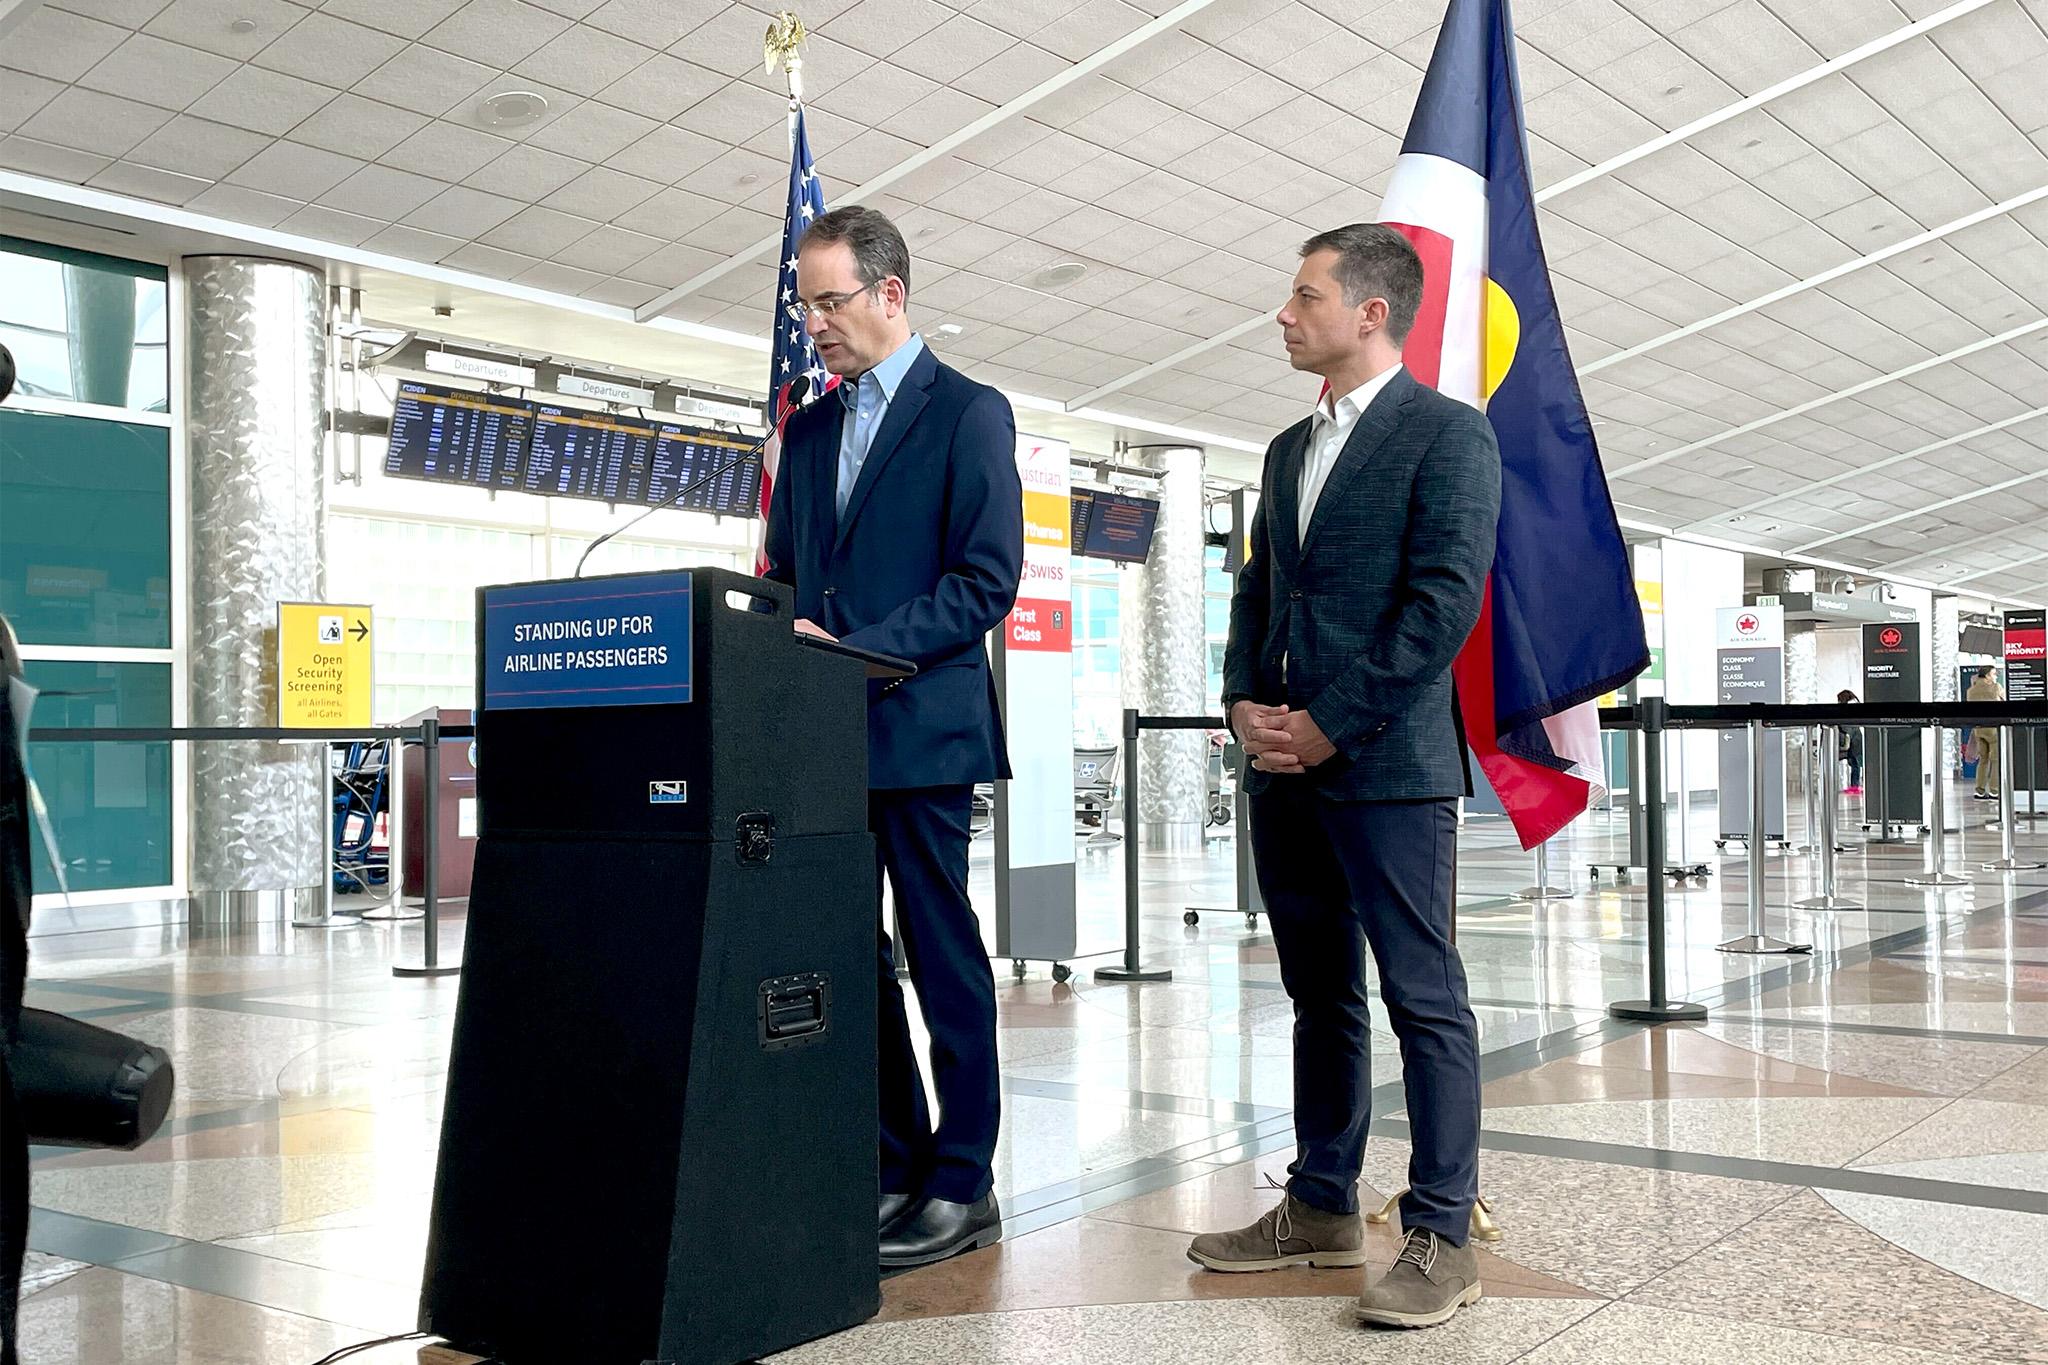
Happy Census week, everyone. The moment is a long time coming.
For a decade, residents, journalists and activists have tried to chart the city's changing demographics. We all knew things were changing - neighborhoods gentrifying and densifying. But a true quantitative analysis hasn't been available since 2010. Until now.
Here's what we know.
Denver, like the rest of the country, has gotten less white.
If you've read any headlines about the U.S. Census Bureau's data drop on Thursday, it was probably something like: "The number of White people in the U.S. fell for first time since 1790." On the national level, the opioid crisis and changes in the way people self-identify are likely causes of this shift.
Between 2010 and 2020 in Denver, the percent of residents who said they identified with multiple races rose drastically, from just four percent to 13.5. The number of people in this town who identified as "white only" dropped from 70 percent to 60.
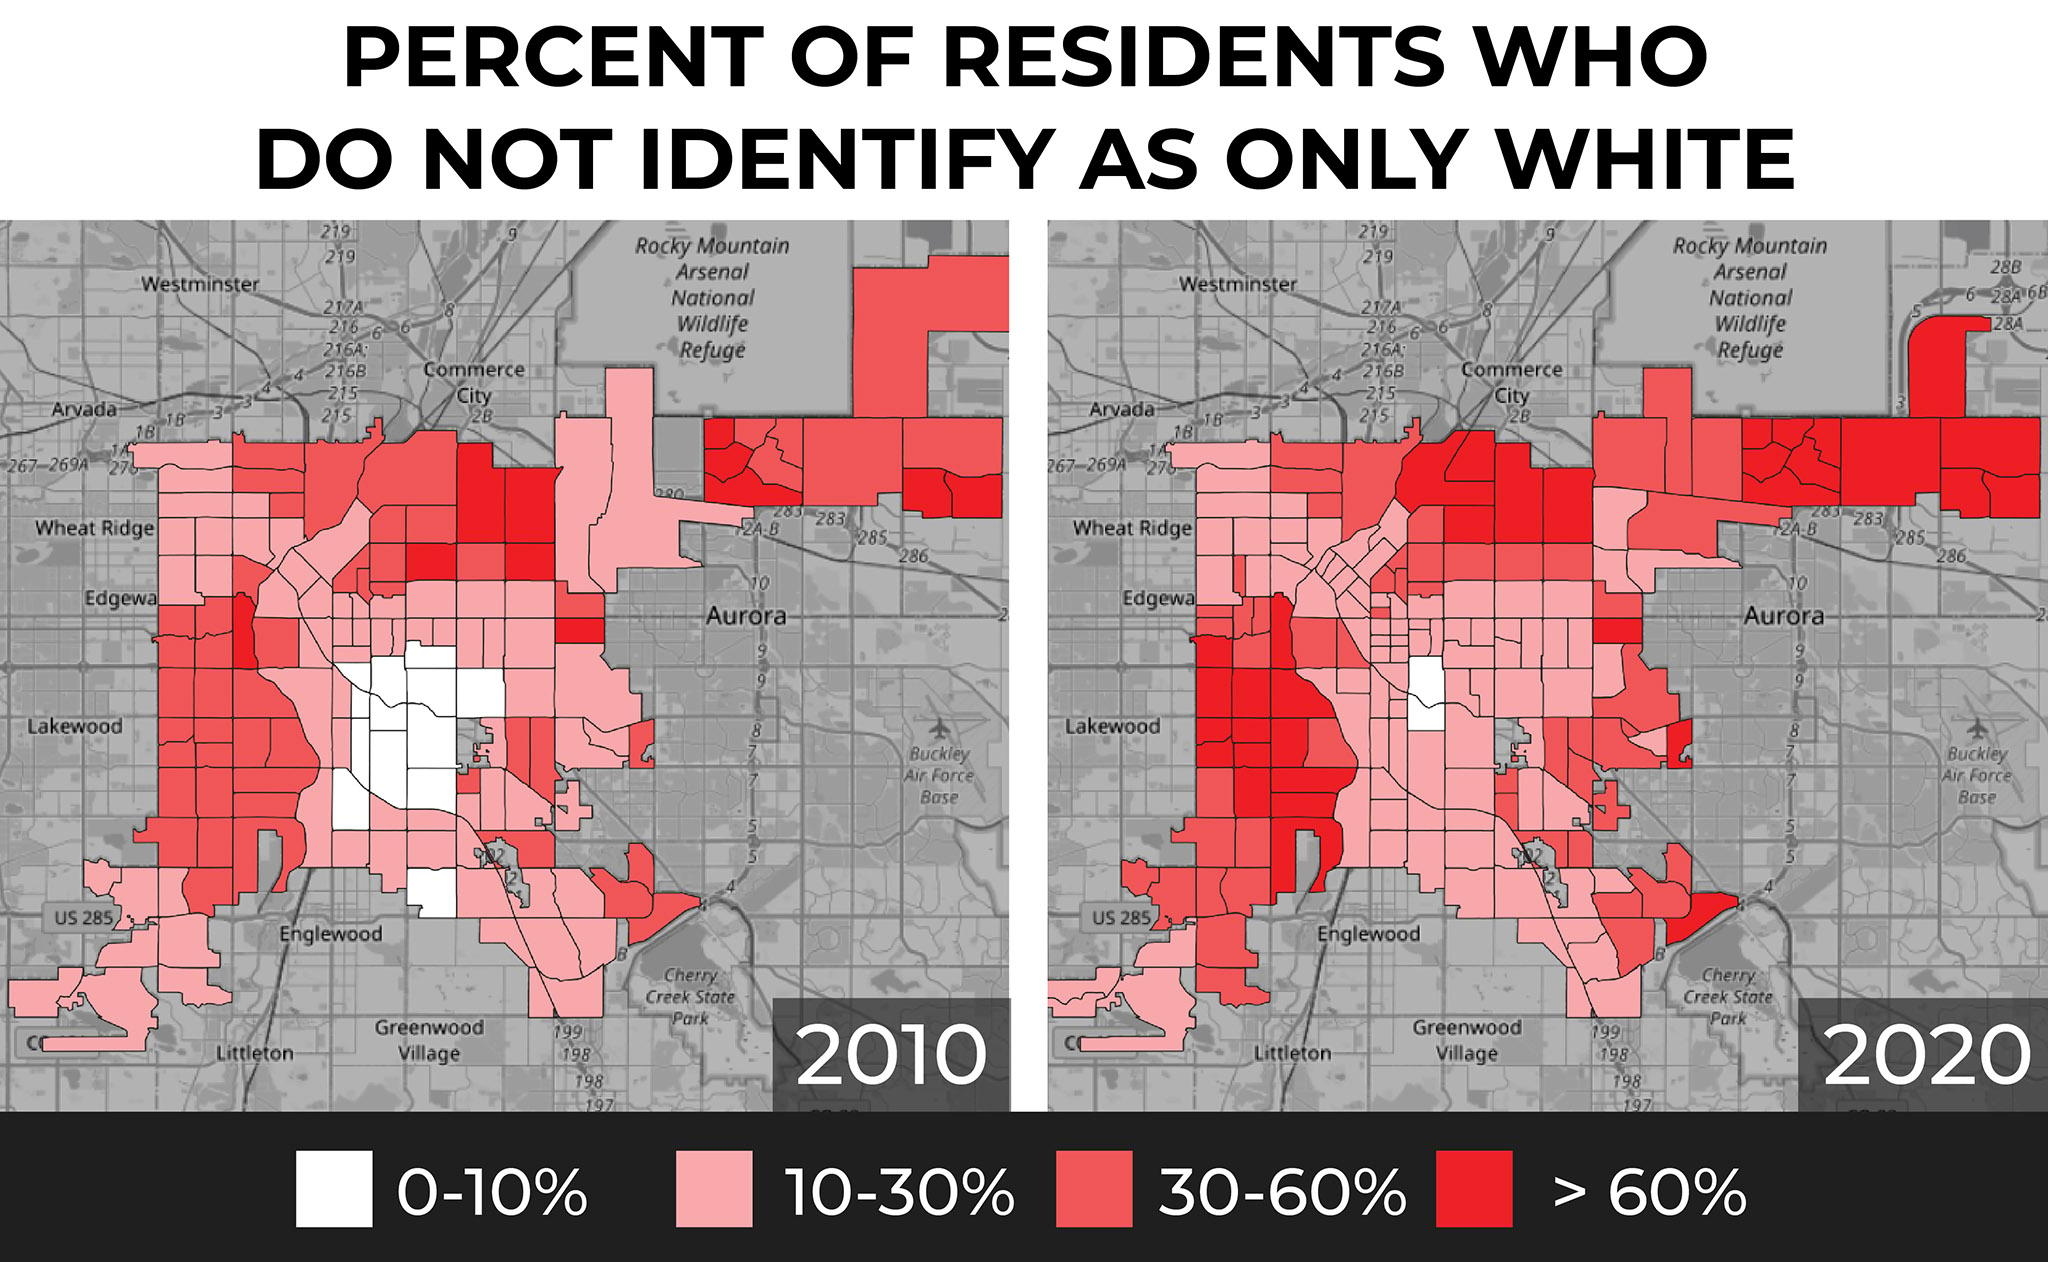
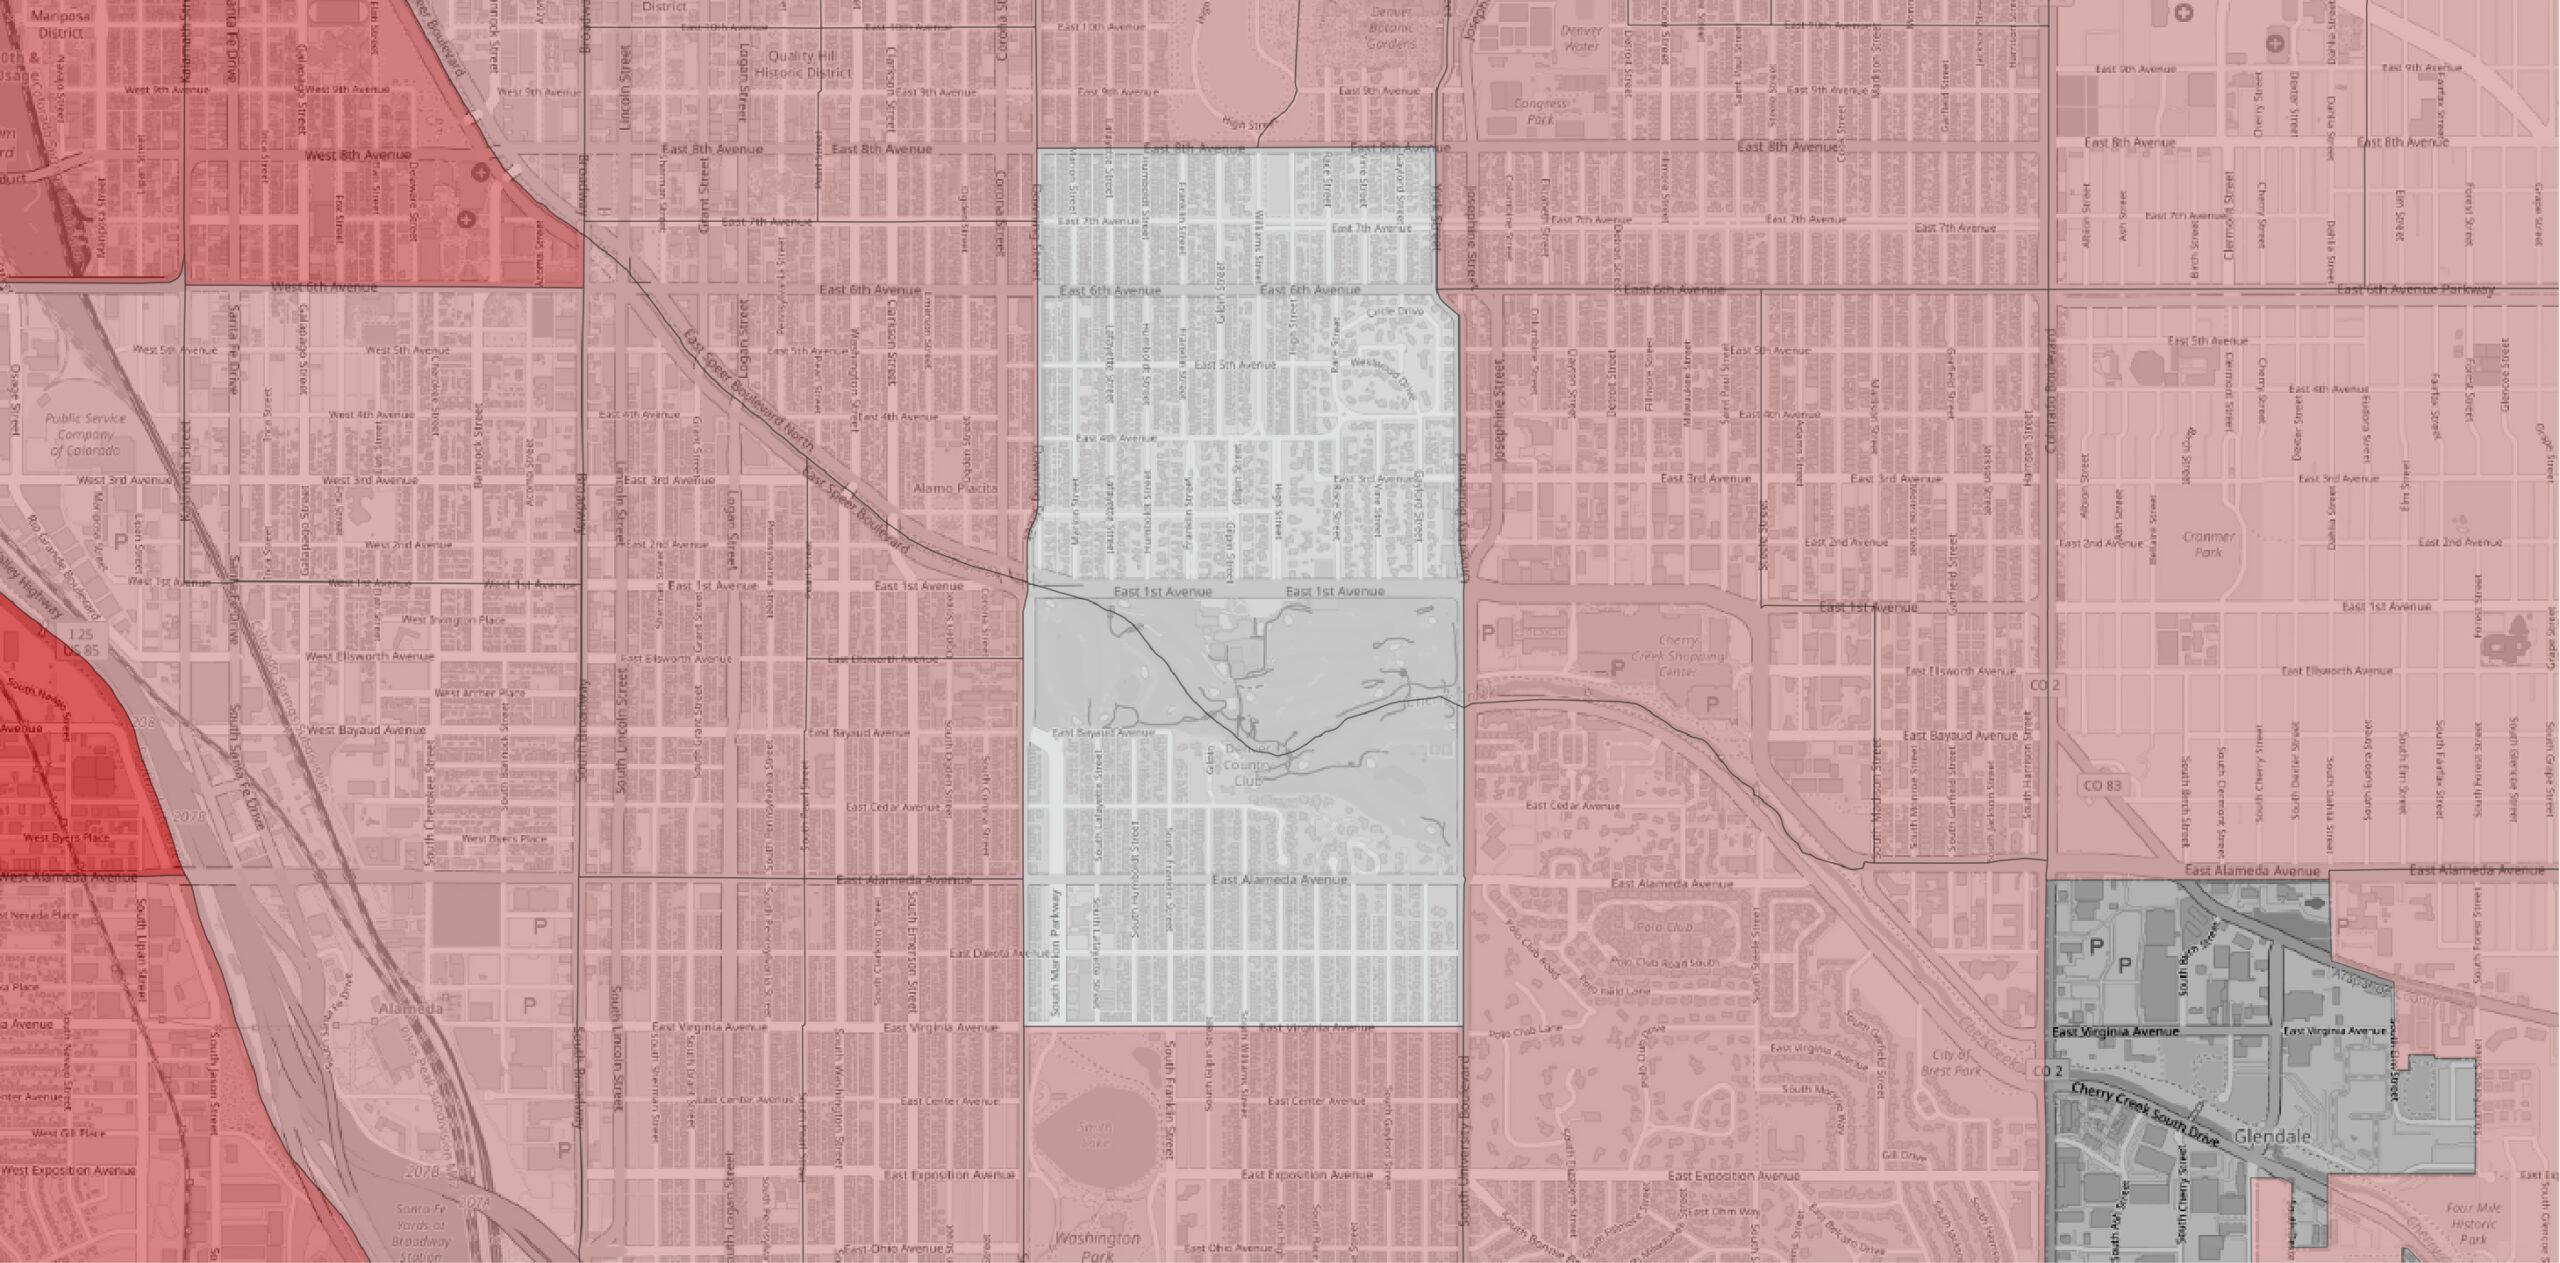
Just two Census tracts in the city came back as overwhelmingly "white" in 2020: Denver's Country Club neighborhood and the top piece of Washington Park. On a map, it's a noticeable shift from 2010.
Another trend noted at the national level is an increase in people who identify as two or more races. That also happened in Denver. Between 2010 and 2020, the percent of residents who said they identified with multiple races rose from just four percent to 13.5.
The numbers also show how gentrification has played out across town.
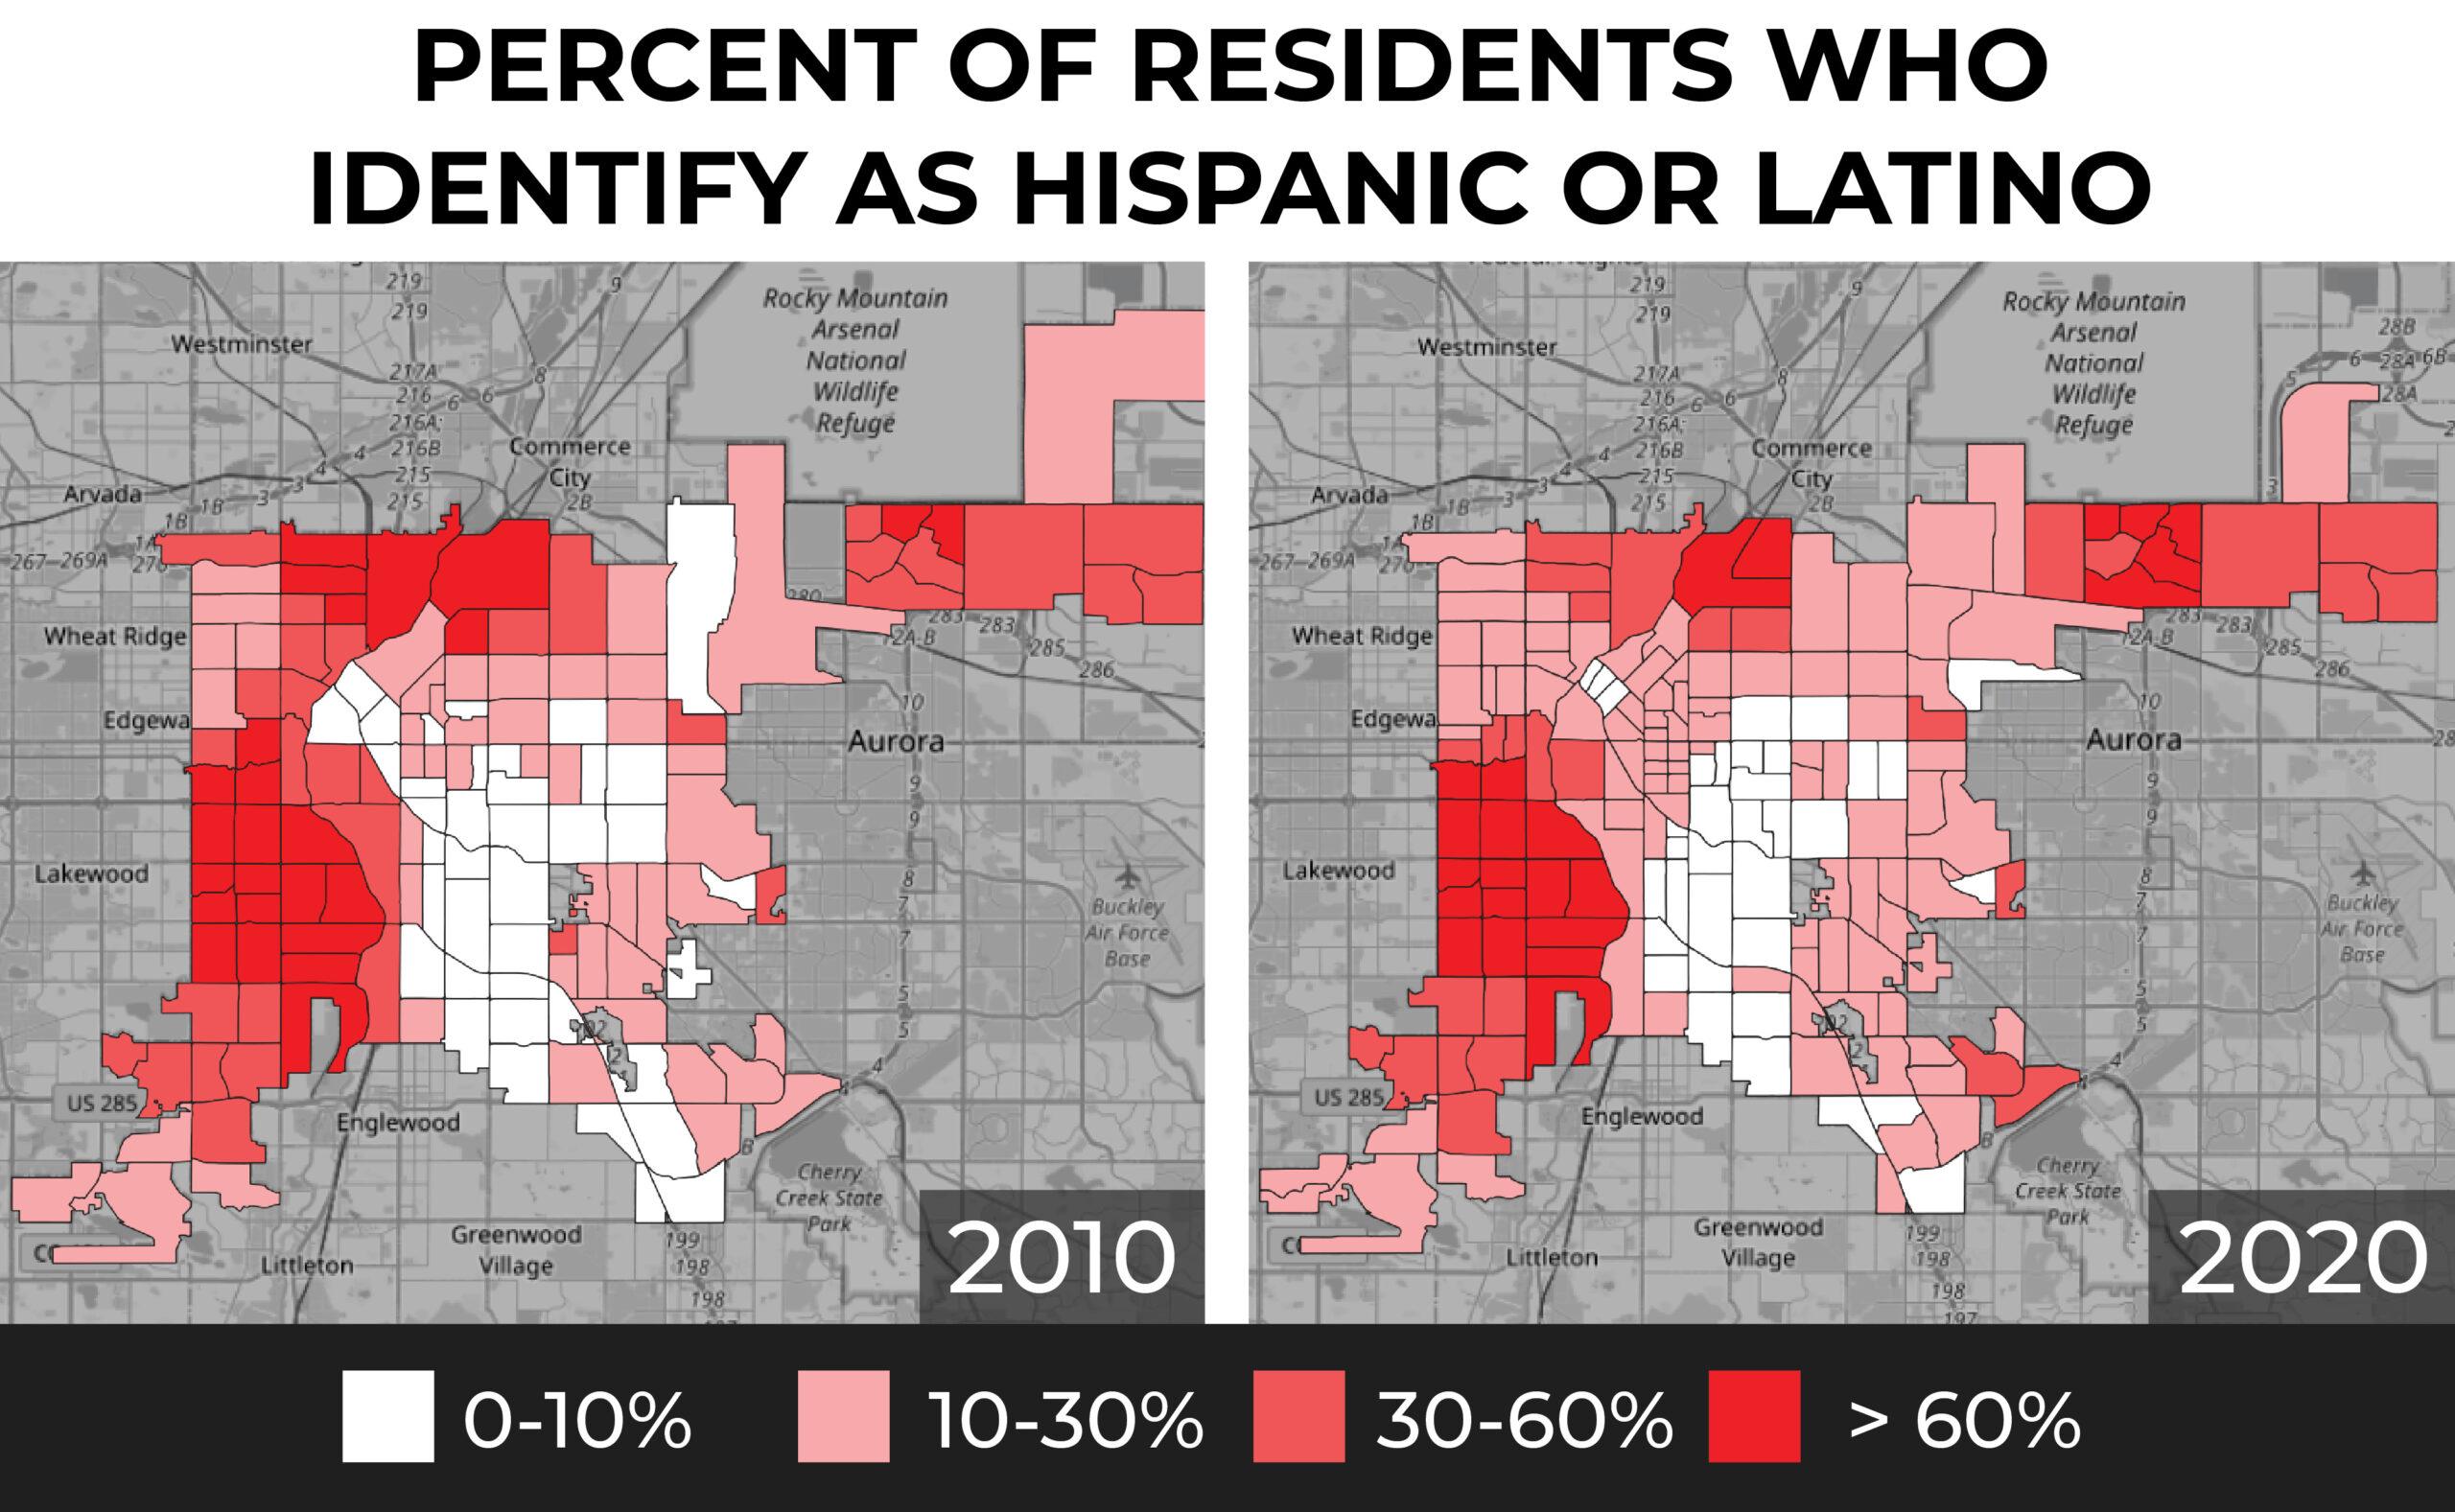
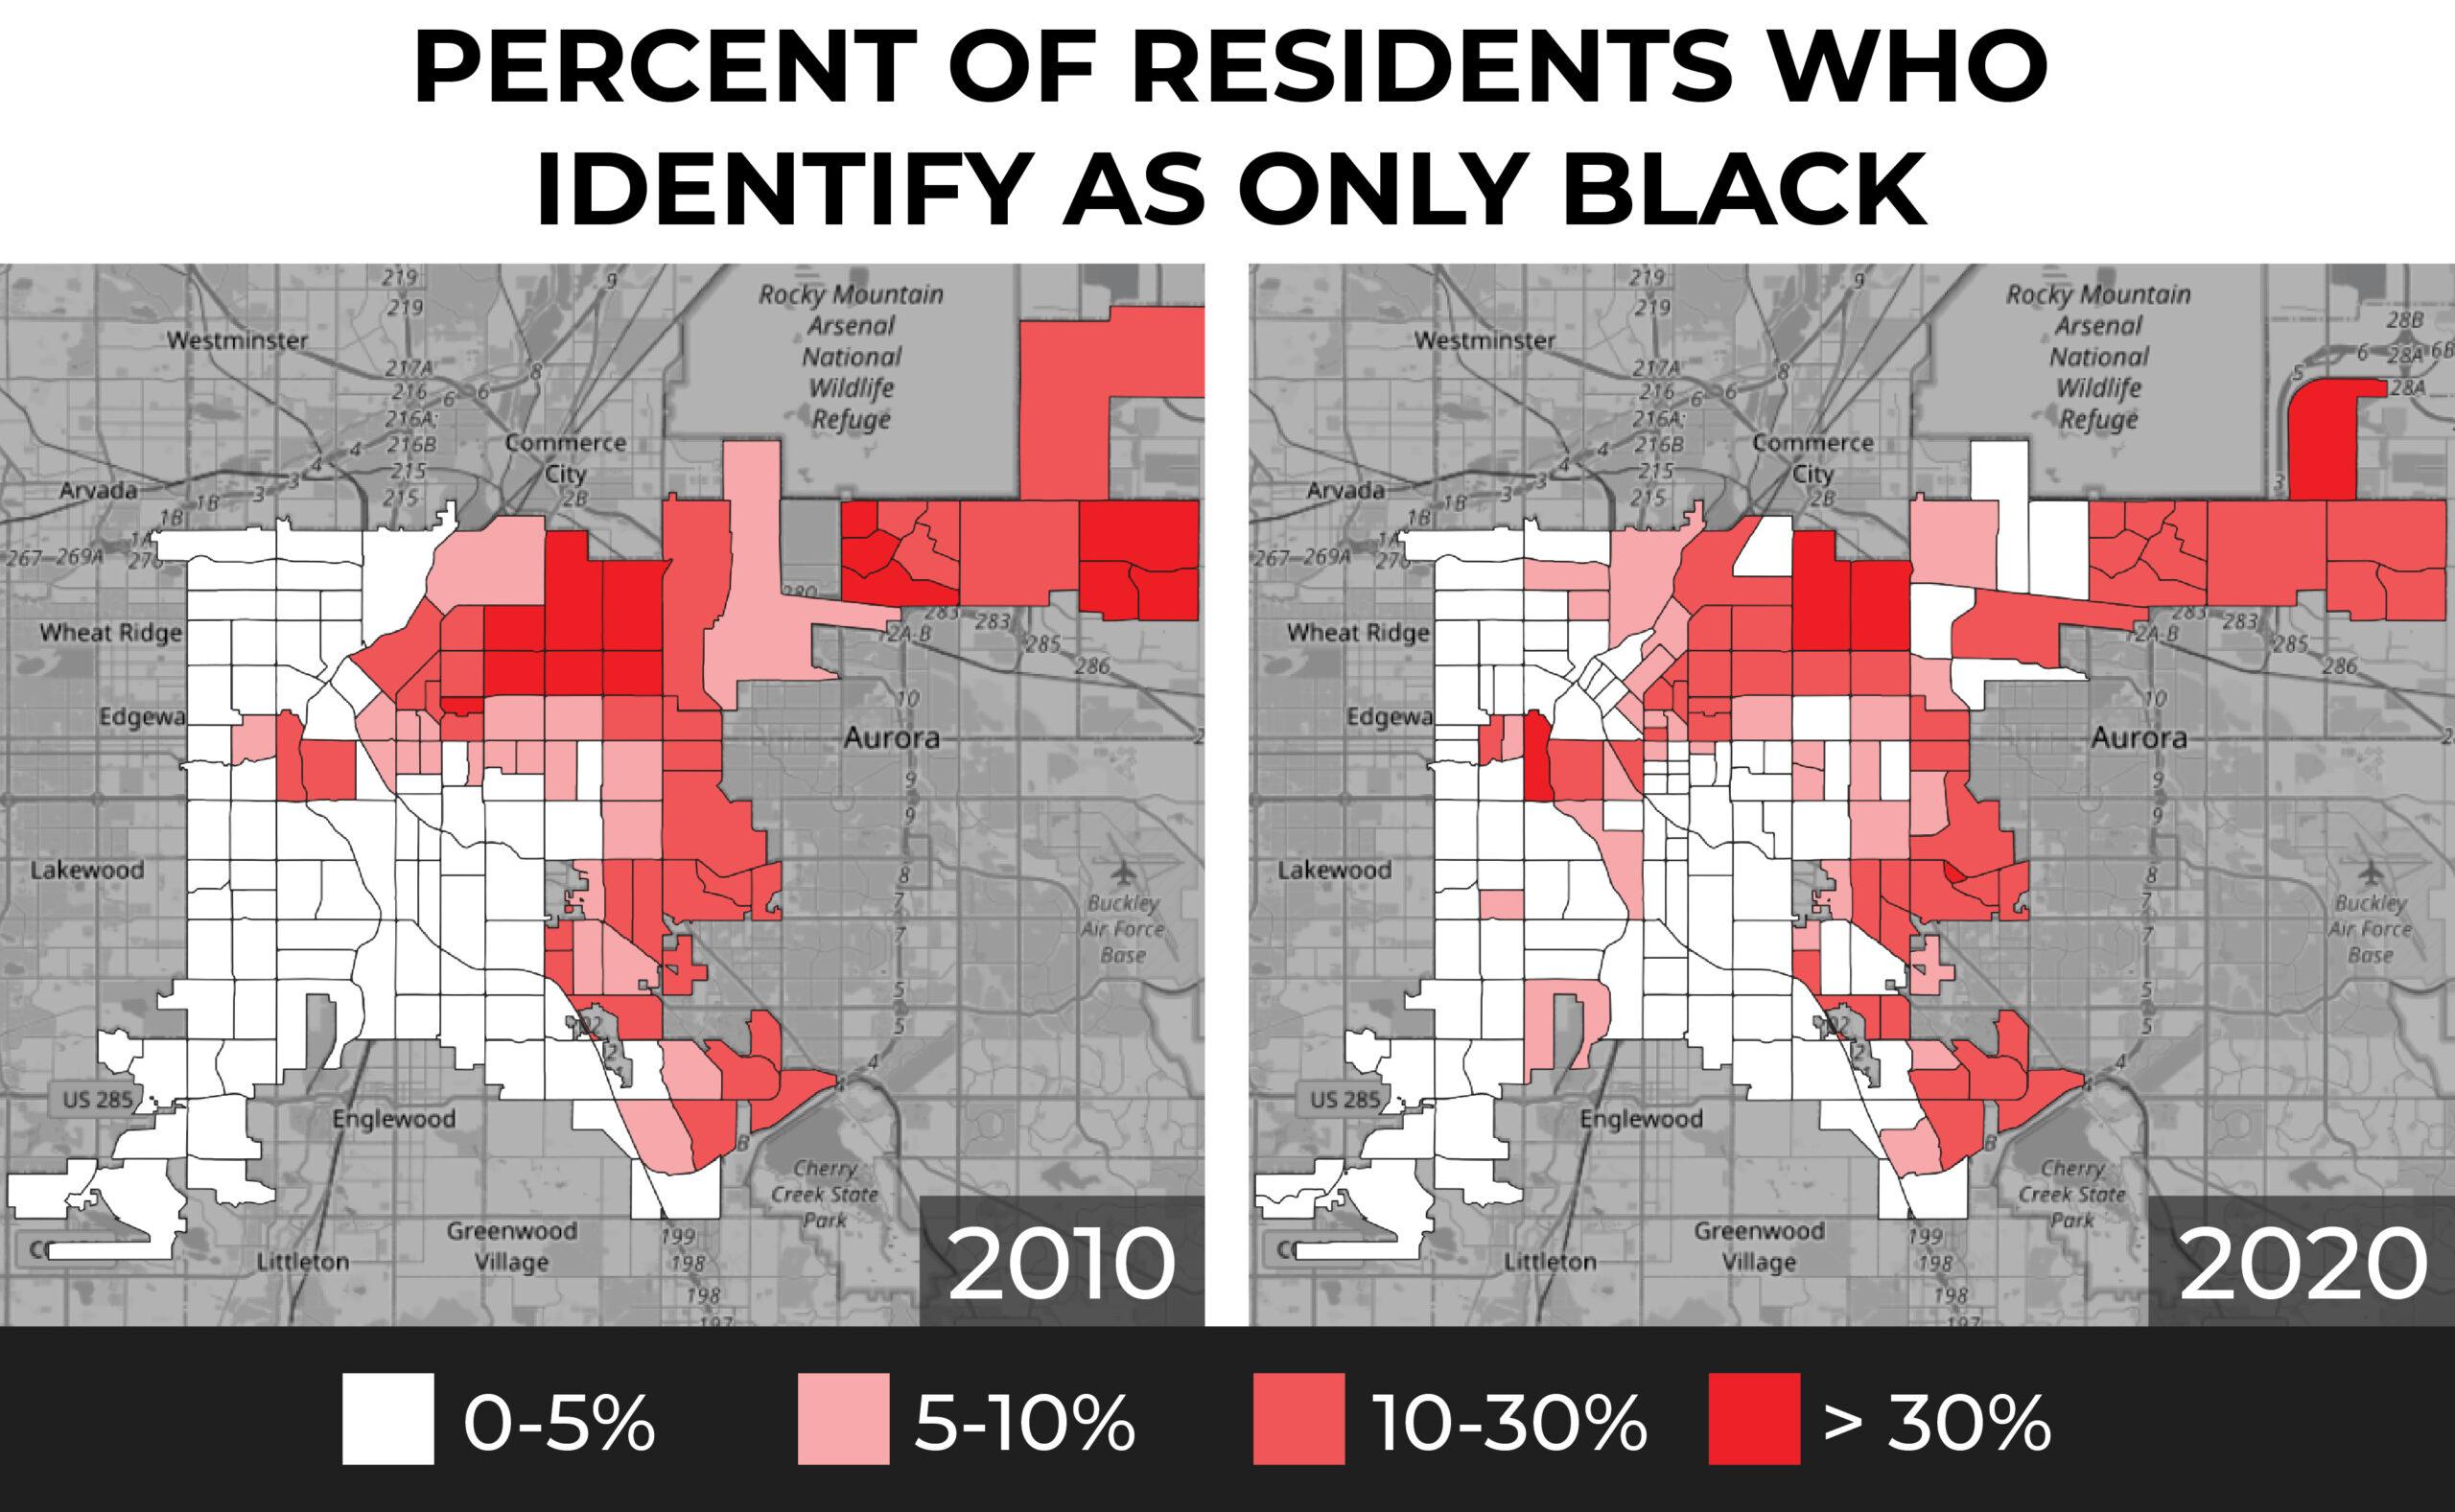
Across the city, the proportion of people who identified as Hispanic/Latino or only Black declined since 2010.
Ten years ago Black residents made up 10 percent of the population. Now they account for nine.
People who identified as Hispanic or Latino (which on the Census is an ethnicity that can encompass any race) fell from 31 percent to 28.
The real news here is changes in where people live.
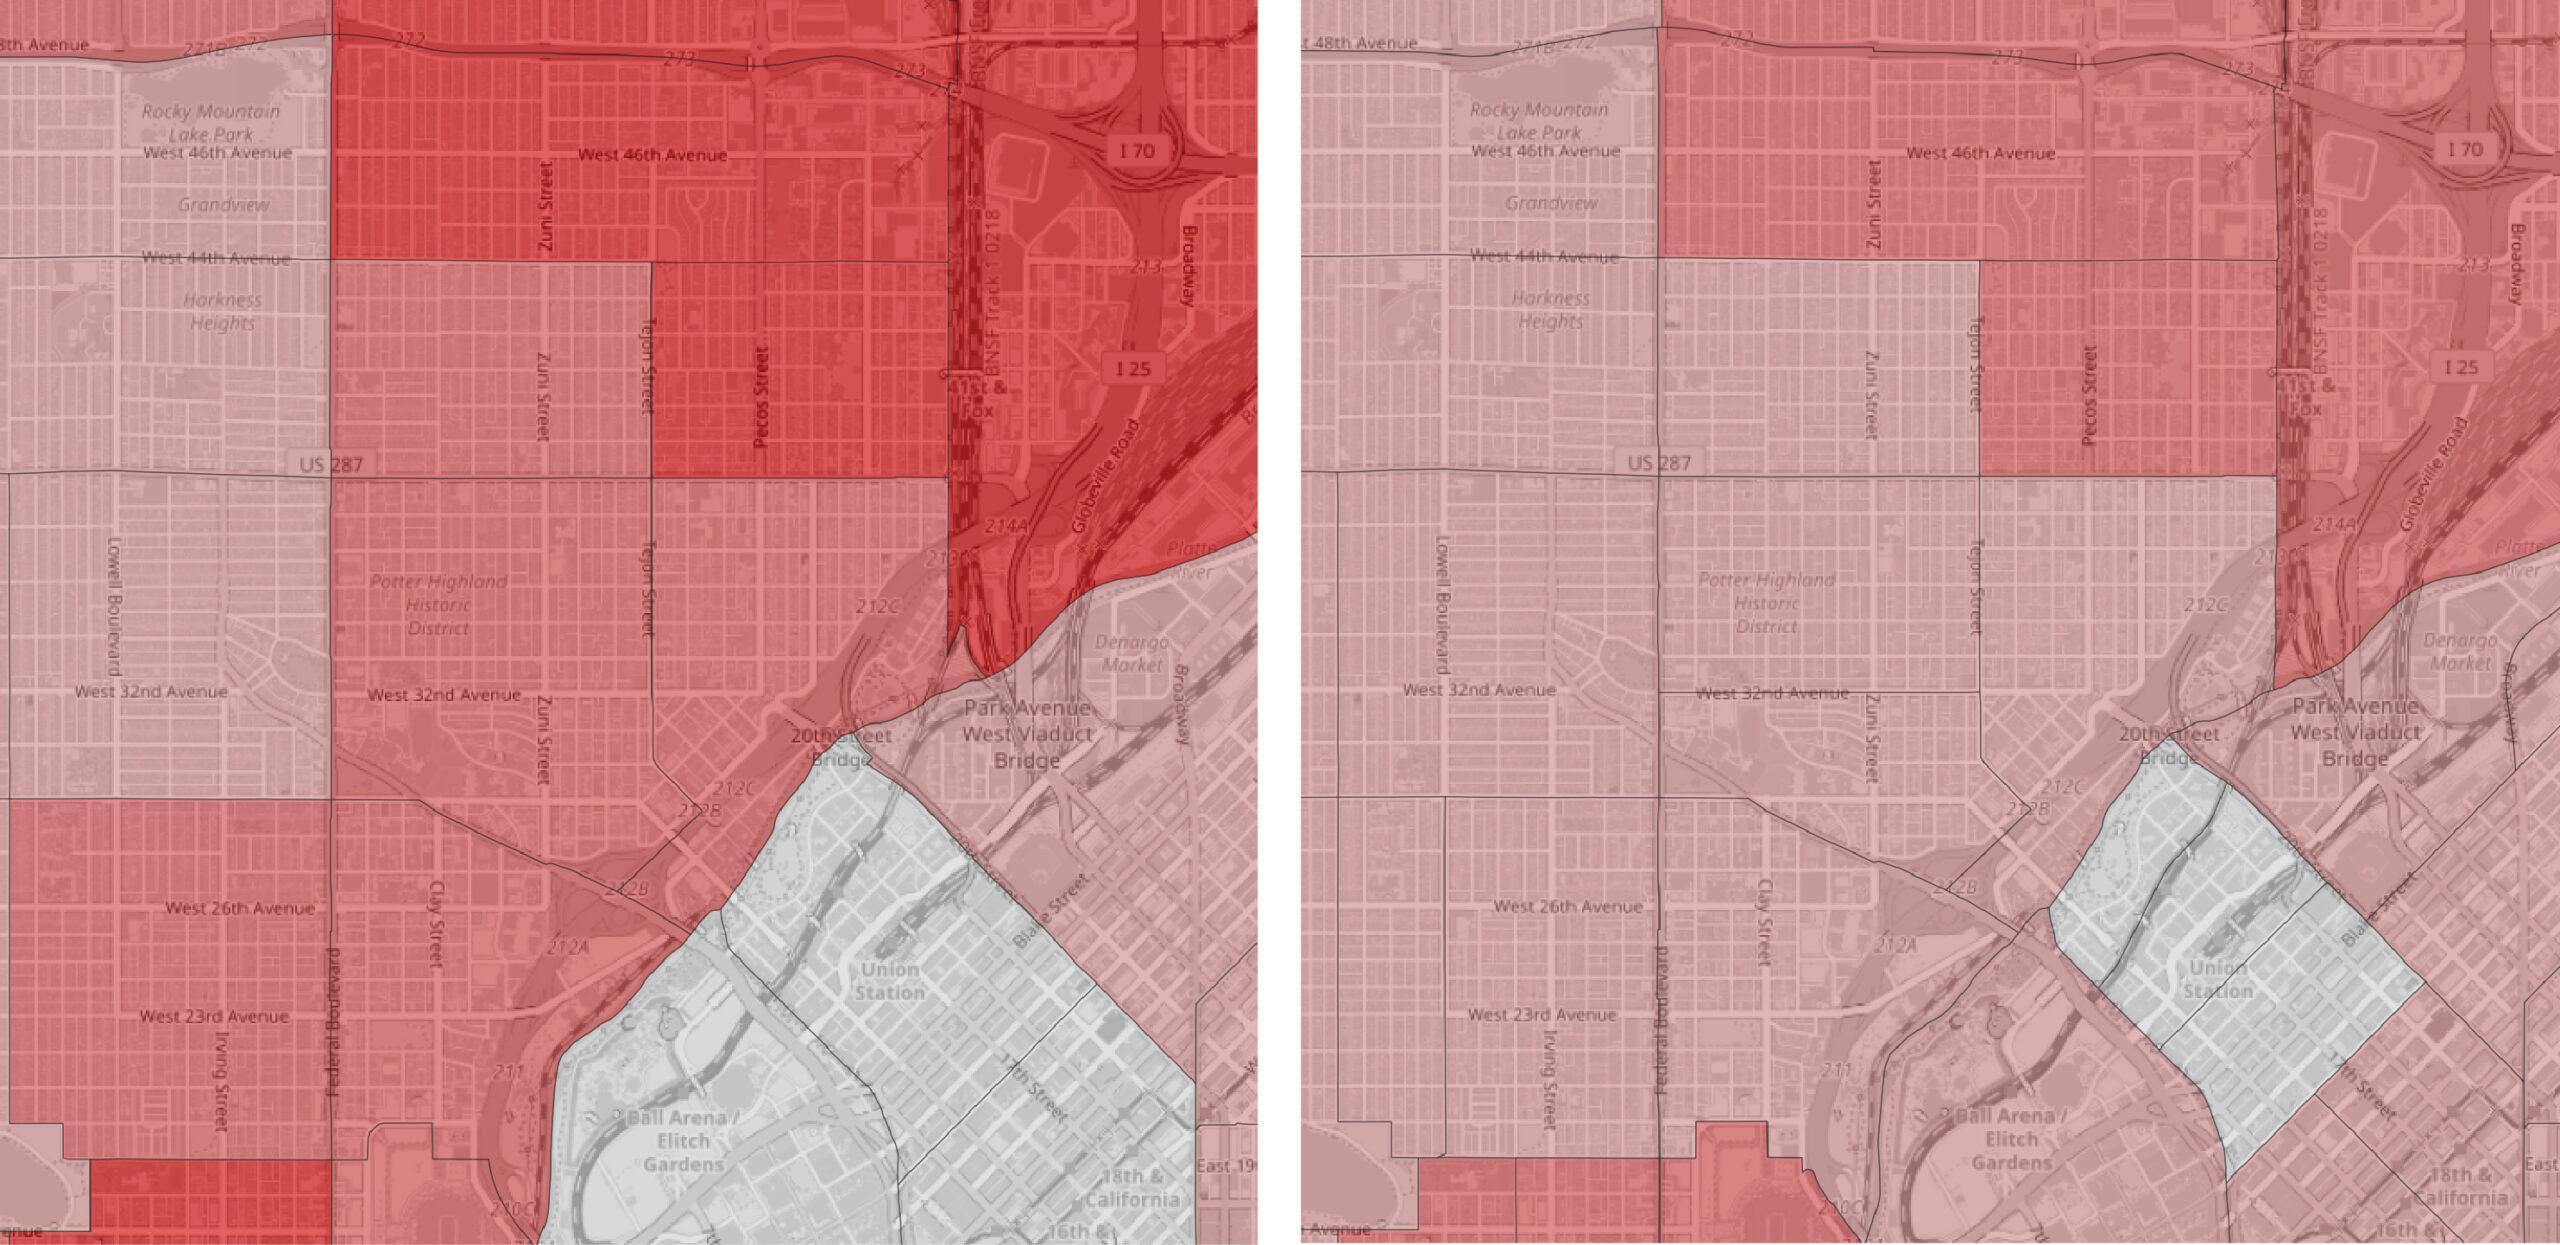
There have long been complaints in Hispanic and Latino communities that the "Northside," Denver's northwest area commonly known now as "the Highlands," has been ground zero for displacement as wealthy people move in, scrape houses and raise property values. It's been such a hot-button issue that a play about gentrification in the neighborhoods sold out for weeks.
In the last decade, people who identify as Hispanic or Latino did become smaller proportion of the Census tracts in the Northside. In the Highland statistical neighborhood, in particular, this slice of the community went from 37 percent of the population to just 16.
Baker saw a similar trend for Hispanic/Latino residents, who dropped from 34 percent to 18 in the last ten years.
(You can see all of the official neighborhood boundaries here. Also, if you're in the mood for a detour, you should read the backstory behind how we got these official neighborhoods in the first place.)
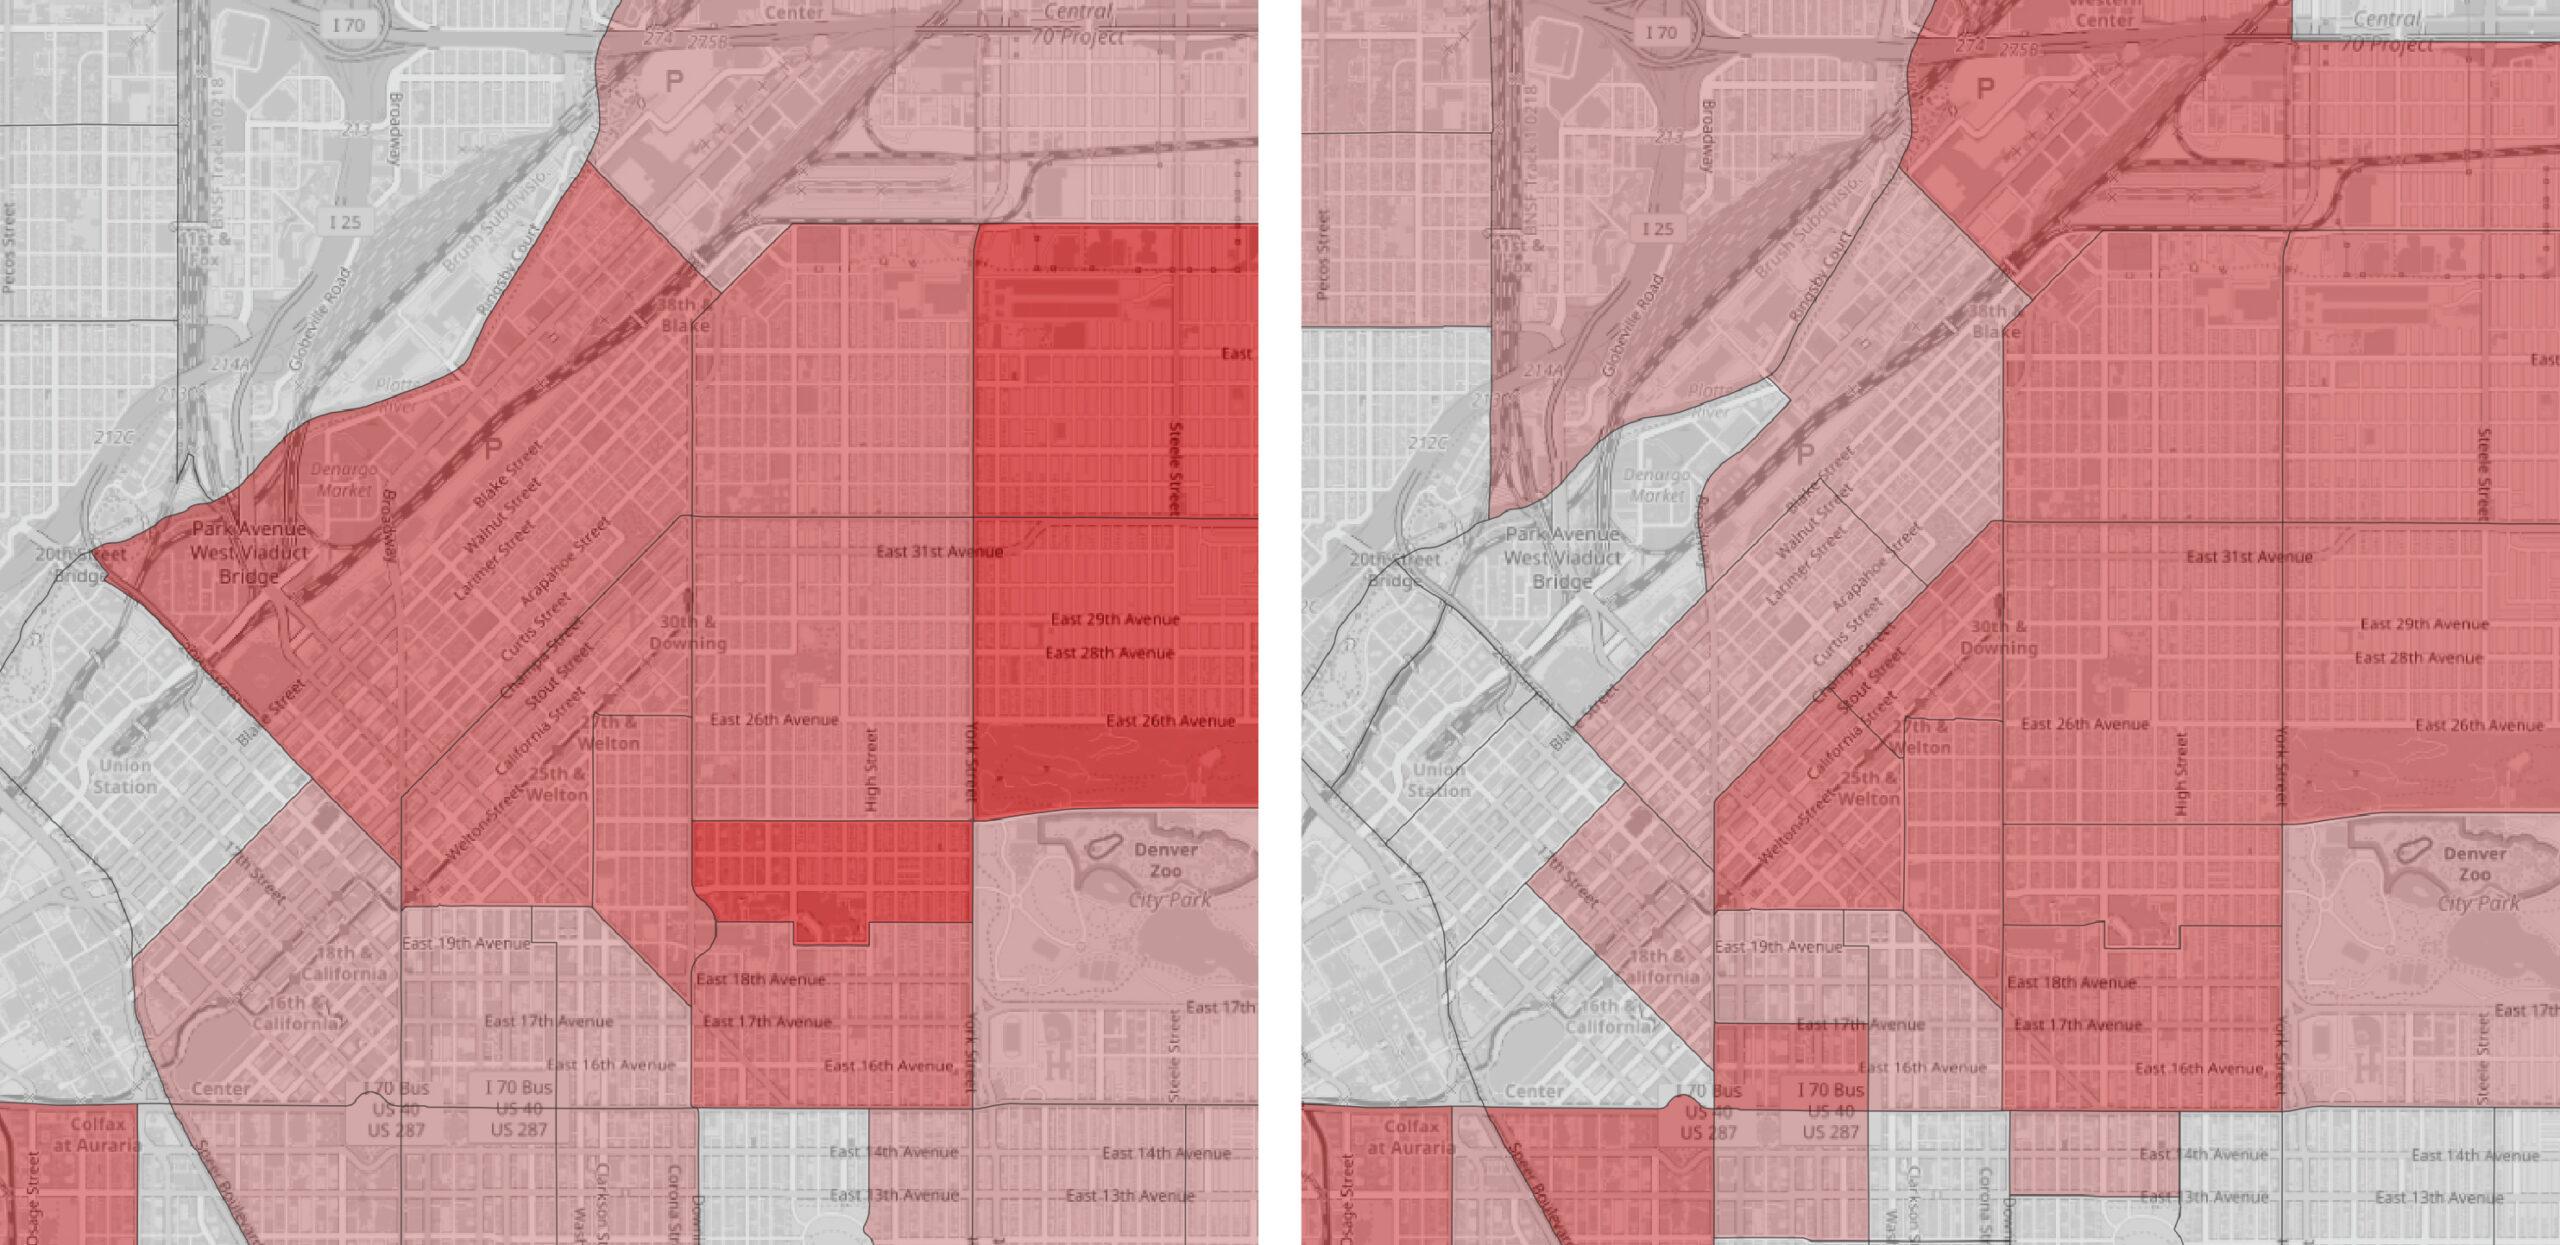
The Census also quantifies how many Black residents moved out of historic neighborhoods as the city grew.
In Five Points, once known as the "Harlem of the West," Black residents represented 16 percent of the population in 2010. A decade later, that number had fallen to 10 percent.
The stats paint a starker picture for Park Hill, the three neighborhoods just east of Colorado Boulevard where many Black families moved after redlining rules, which restricted them to Five Points in the early 20th century, were eased and unwritten. In 2010, Black residents comprised 32 percent of all three neighborhoods - South Park Hill, North Park Hill and Northeast Park Hill. Today, that number has fallen to 21 percent.
While people who identify as only Black and Hispanic/Latino have become smaller proportions of the total population, people who consider their racial identities only Asian, Indigenous or "other" have stayed fairly constant in the last decade.
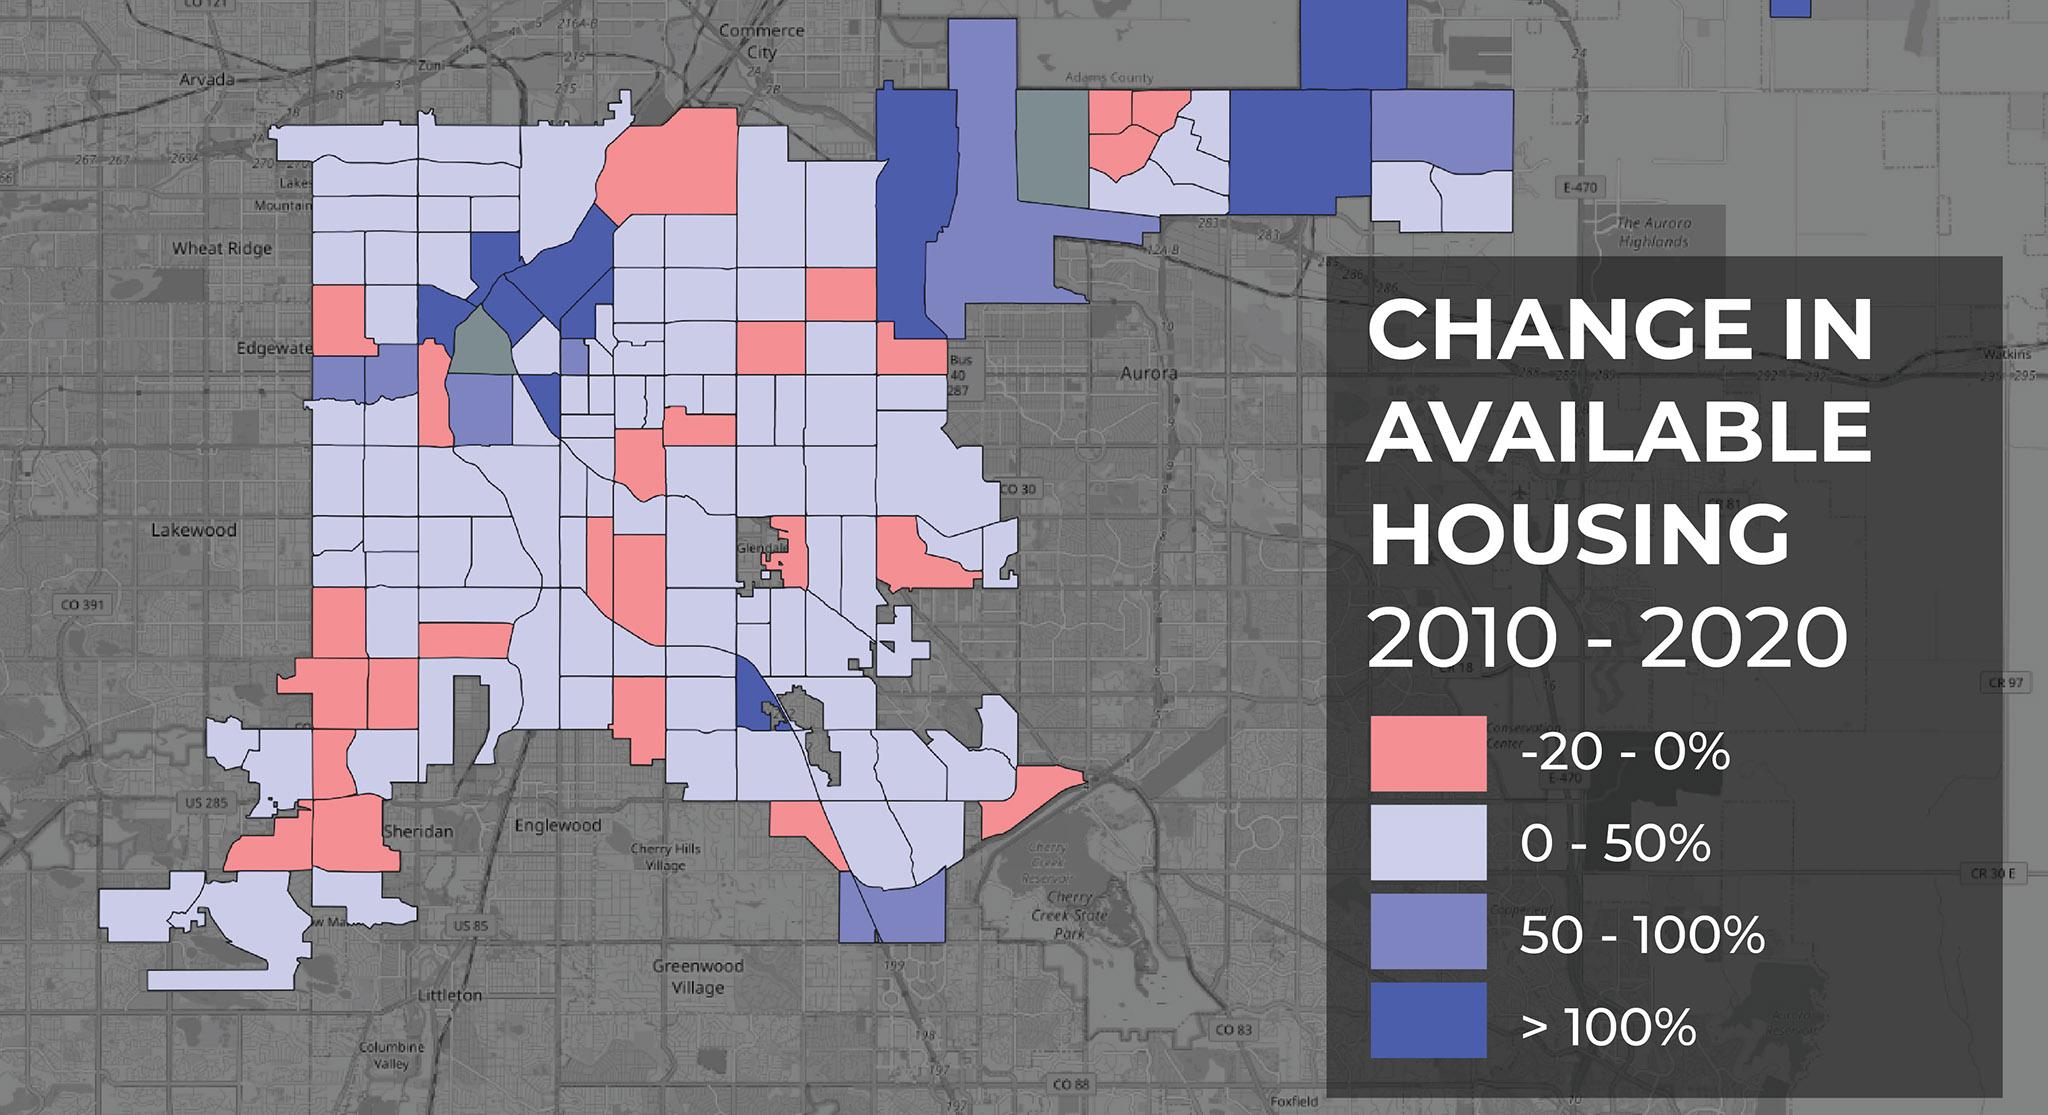
Here's where we've been building houses.
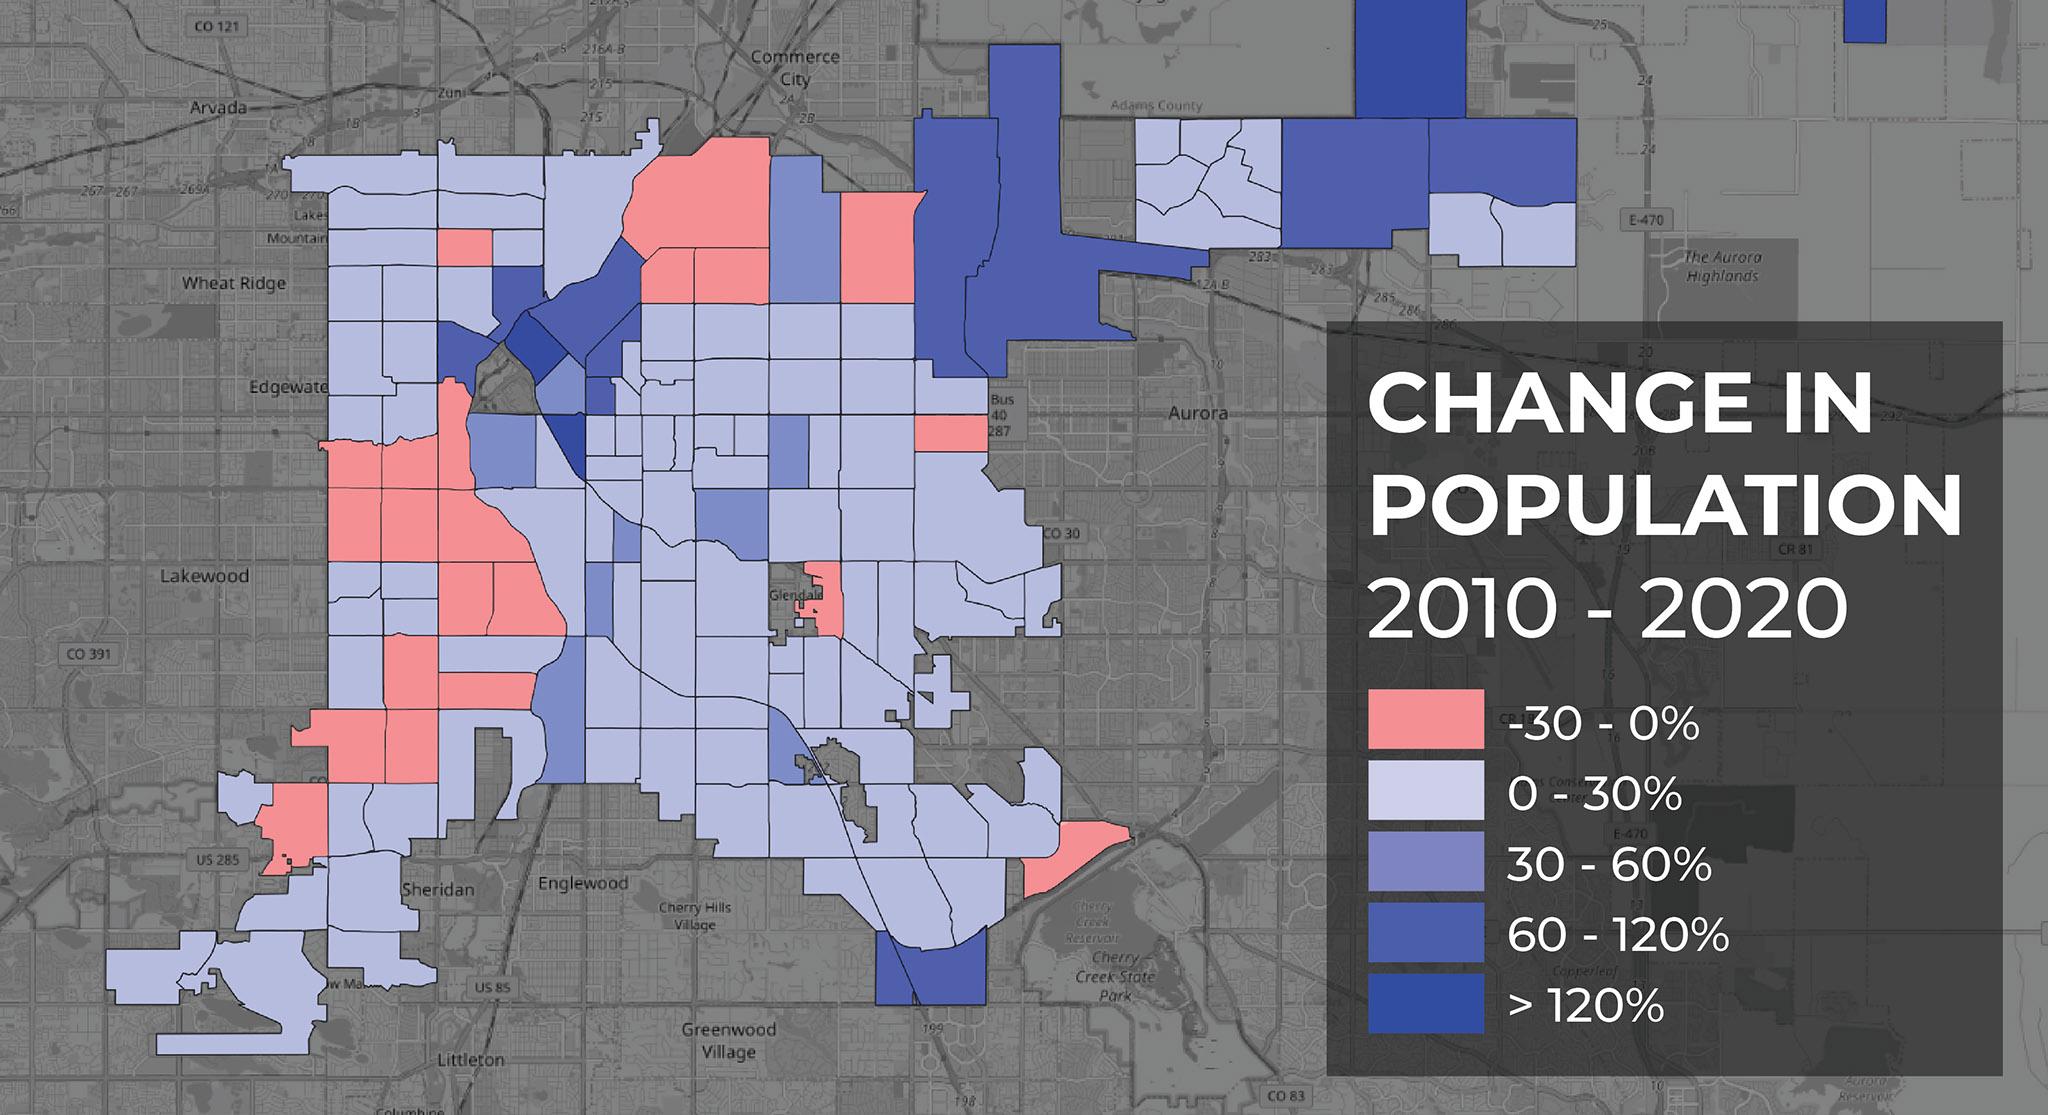
Downtown, the Golden Triangle area south of Civic Center Park, Montbello and Central Park have all seen the most growth in available housing since 2010. The Golden Triangle district, in particular, has seen a lot of luxury (and huge) high-rises come online in the last few years.
But some tracts actually saw decreases in available housing, by as much as 20 percent. These trends more or less mirror overall population losses, which are mapped in the image at the top of this story. Getting to the bottom of why will take some more digging. We have covered one reason why Elyria Swansea, on the city's northern border, has lost both residents and housing. Dozens of homes were scraped in the neighborhood to make way for the National Western Center and I-70 renovation projects. A lot of people who lost homes there didn't stay in Denver when they left.
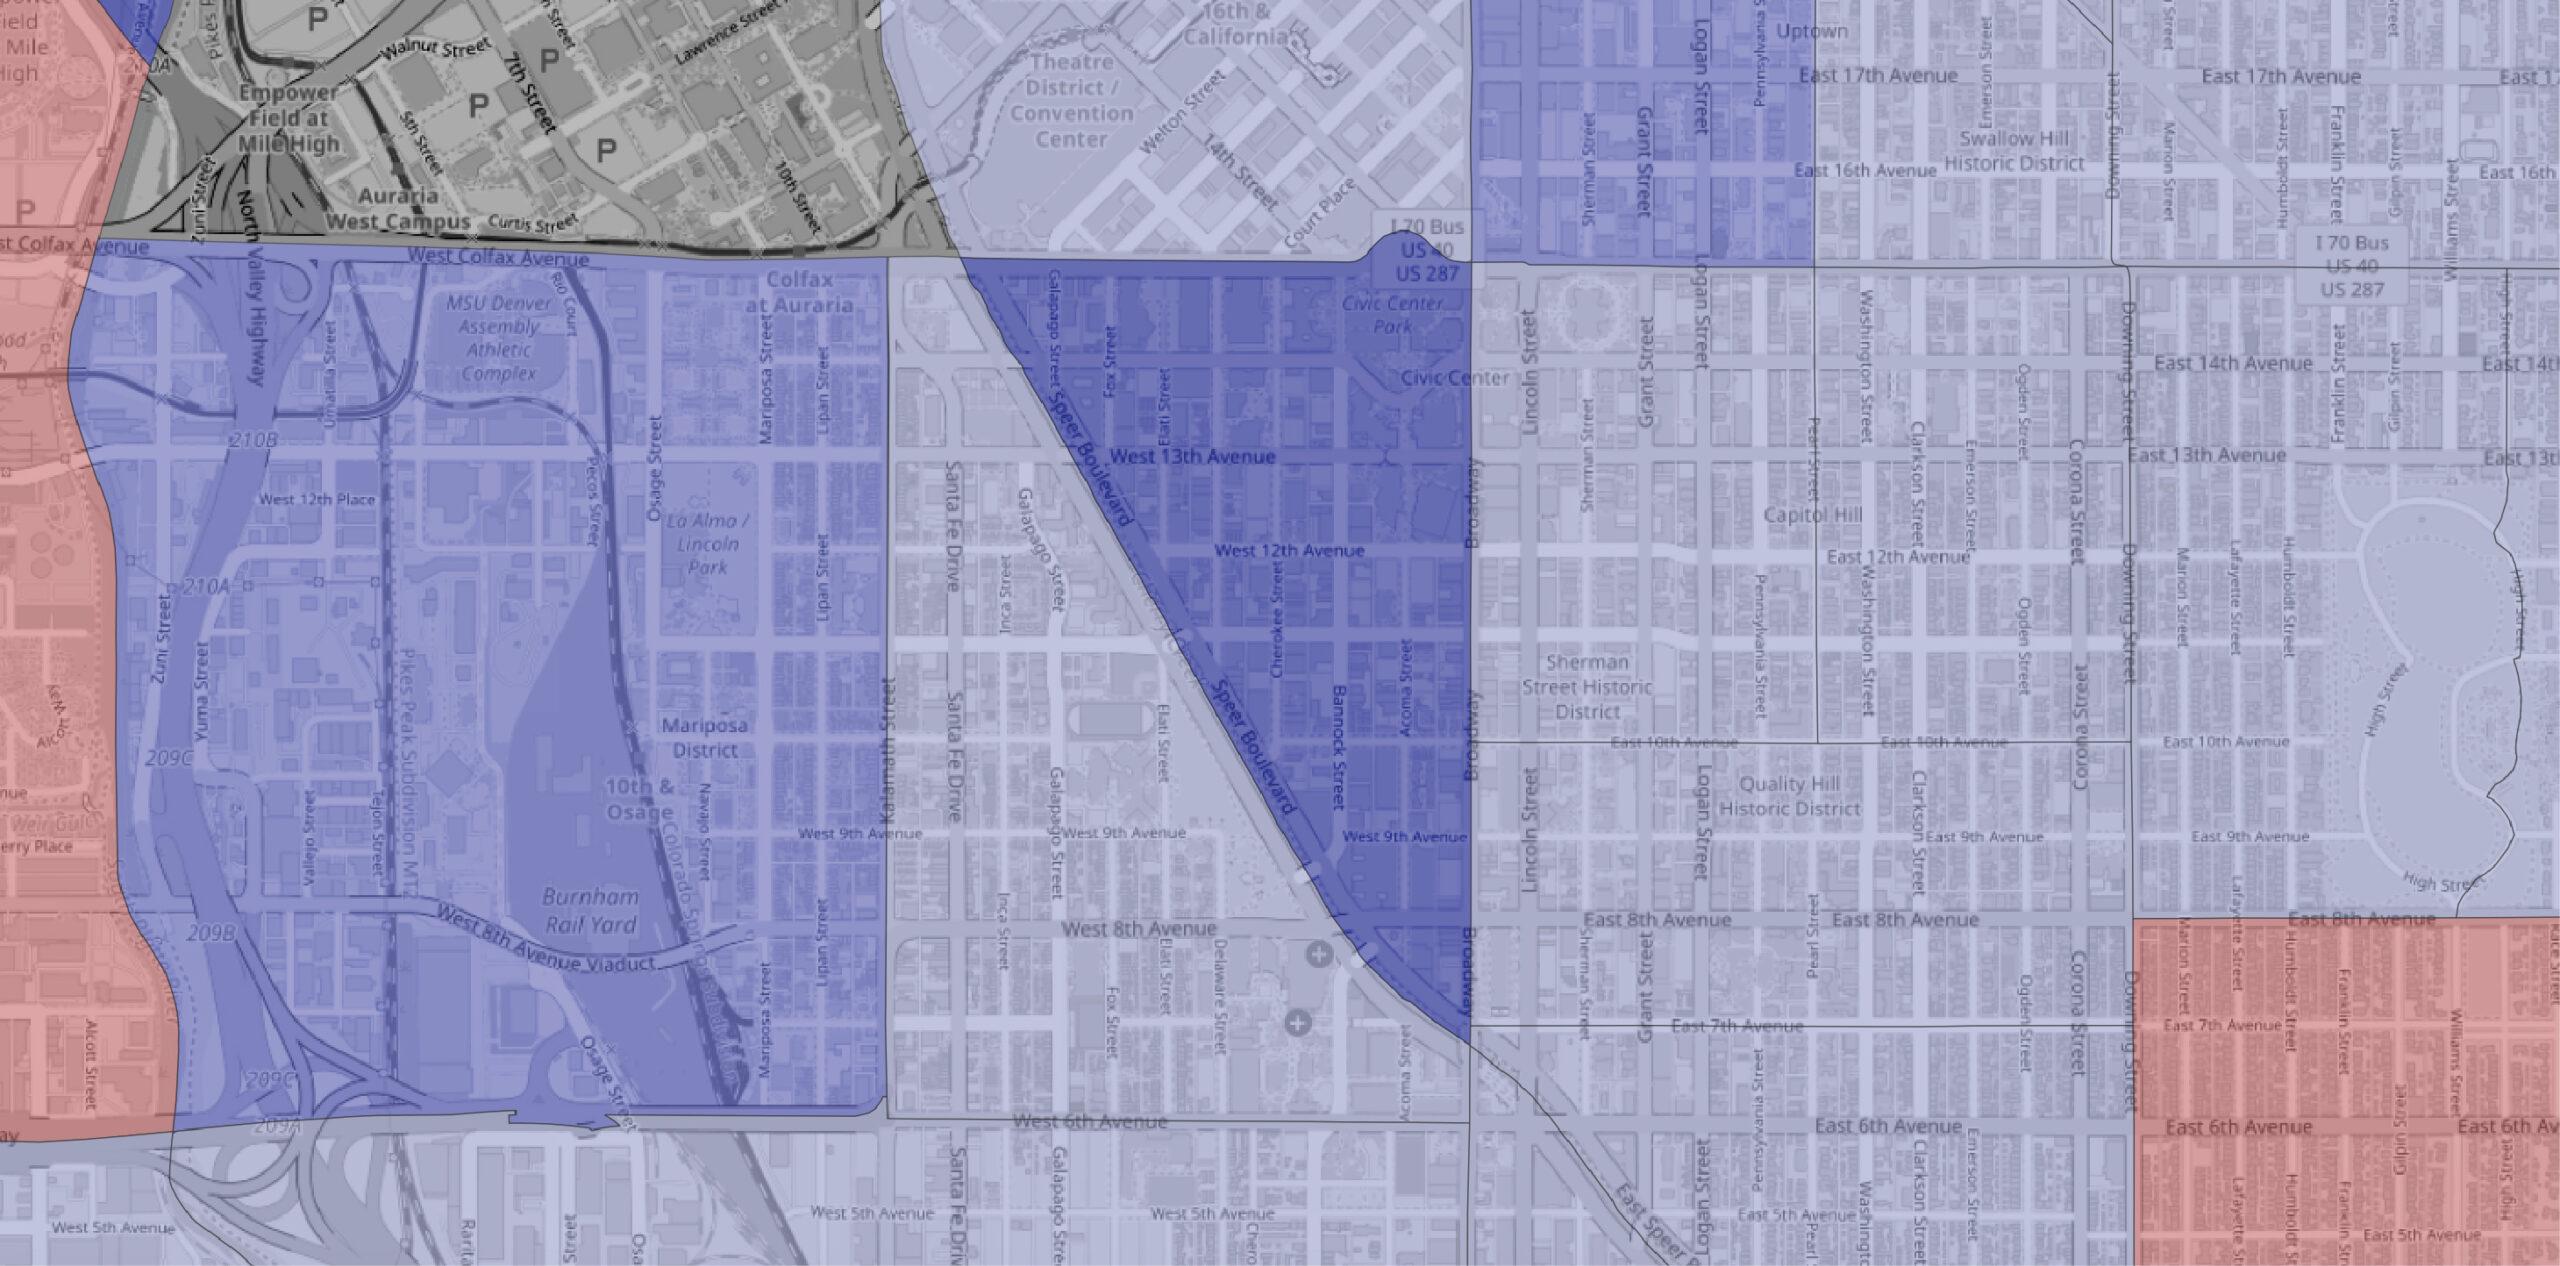
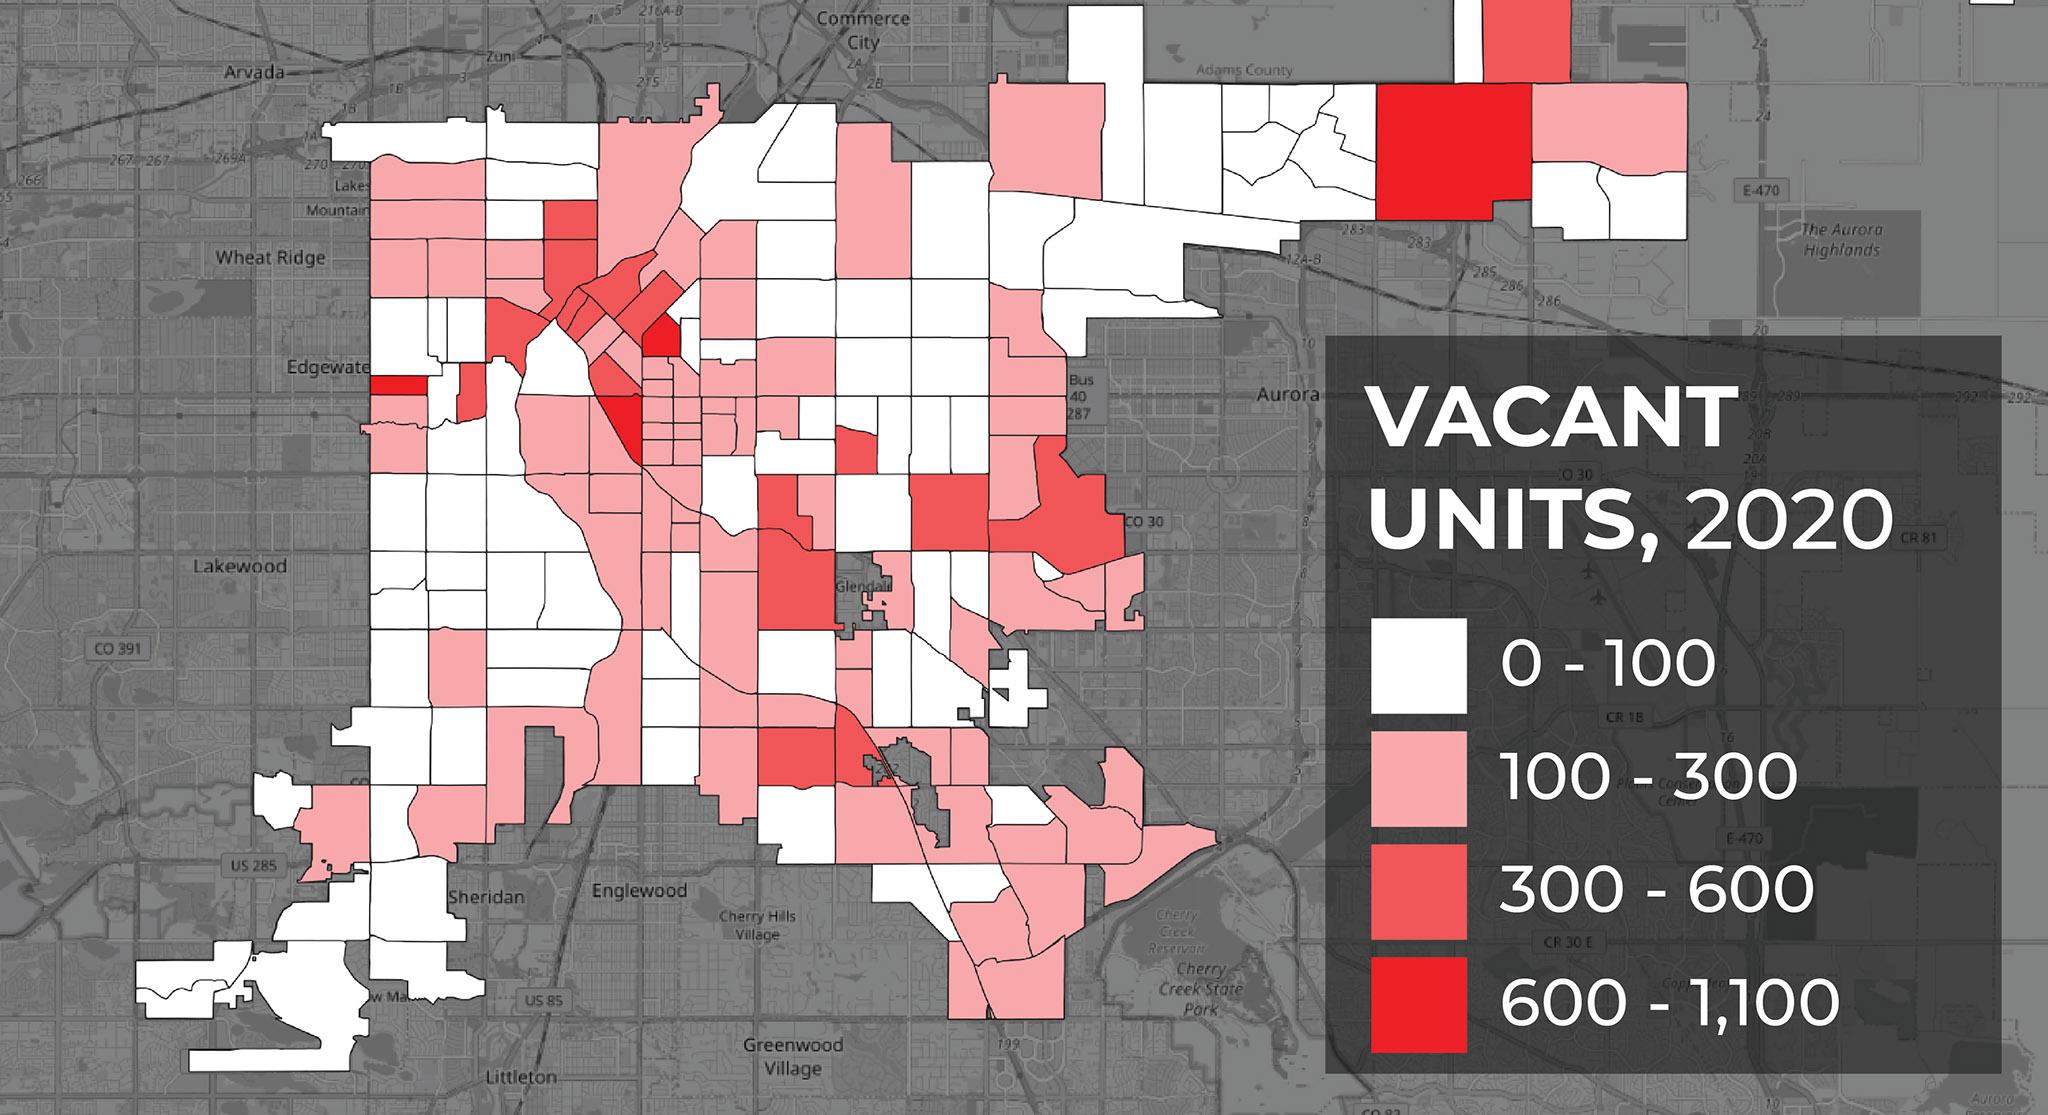
Here's something else that deserves a deeper look: vacant units, of which there were over 27,000 recorded in the Census. In the meantime, here's a map of where they were concentrated. Golden triangle, where all those luxury units have been built, had the second-most empty units on the list. The tract with the most was a southern bit of Five Points, where high-rises also continue to grow along Welton Street.