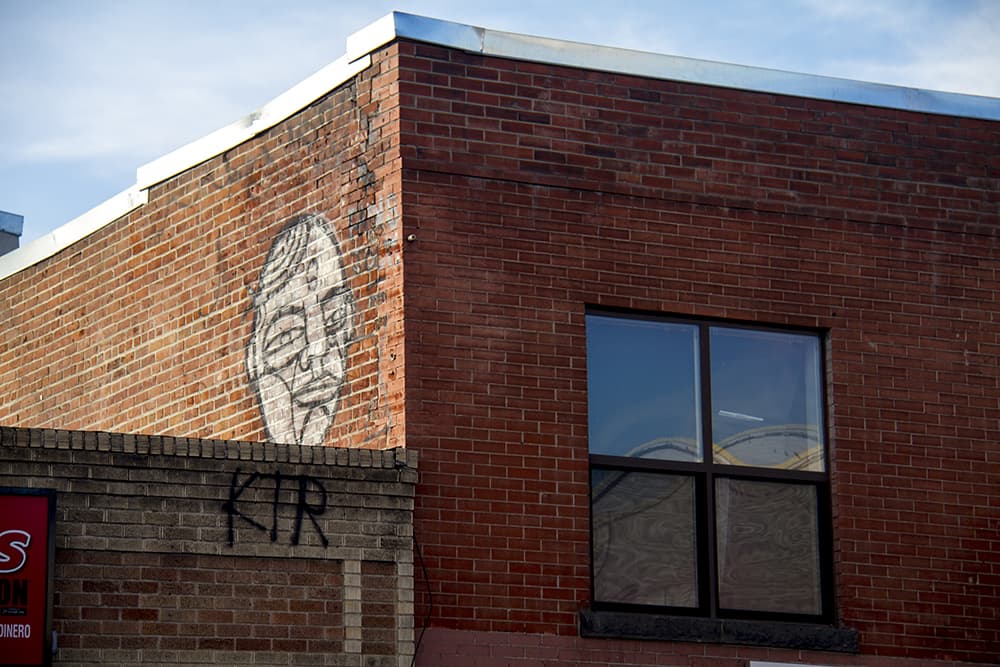
Before Denver's street art program, before even Denver's art districts, there was the unsanctioned public expression known as graffiti.
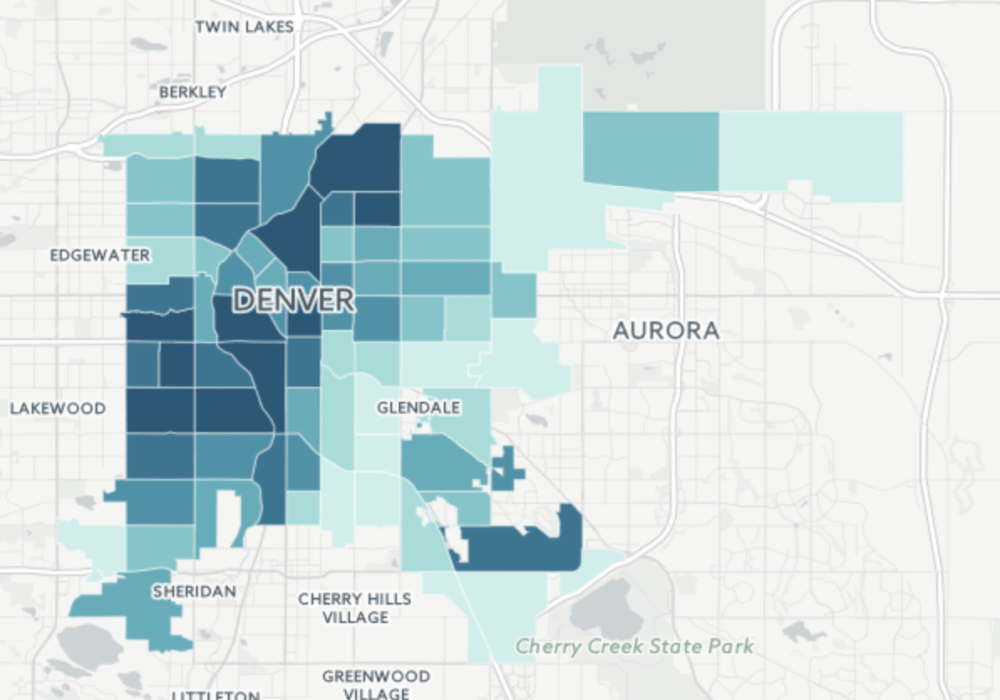
In this Chart of the Week, we take a look at which parts of the city have the most reported graffiti.
Of course, plenty of graffiti goes unreported, Denver Police Department Graffiti Unit Detective George Gray notes. Though DPW removes graffiti, the police catalog it to keep track of gang rivalry, taggers, hate speech, eulogies (RIP messages), declarations of love, and threats.
Graffiti is also a costly form of expression, at least for the city of Denver. Last year, the city allocated roughly $1.2 million removing graffiti. So which areas are most impacted?
According to data from Denver Public Works, Five Points had the most square footage of reported graffiti in 2016. Capitol Hill was about 4,000 square feet behind that.
Here's what it all looks like:
Then behind the neighborhoods, you have the people. Westwood resident Michelle Schoen carries paint in her car to cover tags, plus she says that she reported lots of graffiti in Westwood.
Schoen's concern is that graffiti makes her neighborhood look run-down -- and that it affects morale.
"We found that people in a community with high tagging are fearful. They don't come out of their houses as often, when they do, they're looking over their shoulder," she said. "So the idea is that you take it down so you don't have as many neighbors that are fearful."
All told, DPW removed an estimated 2.1 million square feet of graffiti in 2016. That's quite an improvement from 2013 when the square footage removed was almost twice as big.
Here are the numbers for each Denver neighborhood:
| Neighborhood | Square feet of graffiti removed |
| Five Points | 30,887 |
| Capitol Hill | 26,140 |
| Baker | 23,374 |
| Elyria Swansea | 20,614 |
| Westwood | 20,079 |
| Villa Park | 19,599 |
| Athmar Park | 16,420 |
| Lincoln Park | 14,649 |
| Clayton | 13,531 |
| Barnum | 13,018 |
| Overland | 12,617 |
| Hampden | 11,275 |
| Cole | 11,090 |
| West Colfax | 11,036 |
| Highland | 7,295 |
| Speer | 7,283 |
| Valverde | 6,300 |
| Mar Lee | 5,633 |
| Barnum West | 5,587 |
| Sunnyside | 5,310 |
| Congress Park | 4,987 |
| Civic Center | 4,458 |
| Globeville | 4,282 |
| Cheesman Park | 4,095 |
| North Capitol Hill | 4,042 |
| City Park West | 3,901 |
| Ruby Hill | 3,855 |
| Indian Creek | 3,800 |
| Platt Park | 3,670 |
| Harvey Park | 3,439 |
| Auraria | 3,238 |
| CBD | 2,502 |
| Skyland | 2,439 |
| College View - South Platte | 2,385 |
| Union Station | 2,363 |
| South Park Hill | 2,310 |
| Sun Valley | 2,150 |
| Fort Logan | 2,020 |
| Virginia Village | 2,002 |
| City Park | 1,900 |
| Washington Park West | 1,737 |
| East Colfax | 1,675 |
| Berkeley | 1,357 |
| Montbello | 1,272 |
| Northeast Park Hill | 1,220 |
| Jefferson Park | 1,105 |
| West Highland | 1,039 |
| Harvey Park South | 965 |
| Goldsmith | 960 |
| Hale | 835 |
| Whittier | 832 |
| North Park Hill | 705 |
| Chaffee Park | 680 |
| Cherry Creek | 640 |
| Country Club | 630 |
| Sloan Lake | 561 |
| Washington Park | 410 |
| Regis | 400 |
| University Hills | 340 |
| Montclair | 320 |
| Washington Virginia Vale | 300 |
| Rosedale | 290 |
| University | 197 |
| Kennedy | 160 |
| Bear Valley | 100 |
| Stapleton | 100 |
| Gateway - Green Valley Ranch | 76 |
| Cory - Merrill | 44 |
| Lowry Field | 40 |
| University Park | 28 |
| Southmoor Park | 25 |
| Hilltop | 15 |
| Hampden South | 8 |
| Belcaro | 4 |
