Last month, the Environmental Protection Agency dropped the latest overview of its Toxic Release Inventory (TRI) program. The dataset is a clearing house for waste produced at industrial sites across the nation, both intentional and accidental. The 2019 numbers actually came out last autumn, and 2020's numbers won't come out until next autumn. But the new report gave us an excuse to look at the data on super-local pollution.
The numbers are complicated. For one thing, they don't necessarily reflect pollution that enters environments around these sites. A significant portion of what the EPA tracks is stuff that's been hauled out to landfills or recycled. We'll break down some of this information to get a closer look at chemicals that are released onsite.
One more caveat for you: These numbers represent how much waste is produced, but they're not meant to communicate any sort of health risk. Our analysis encapsulates reporting from 88 sites around the city, and the data includes 73 chemicals produced both in regular industrial processes and unplanned "one-time releases." Some of the chemicals are bad for you, while others are less of a concern. Any potential health impacts depend on where and how concentrated these chemicals were when they were generated and when they were actually generated.
Let's start with the big picture: What does the EPA's new report say about the metro and the broader region?
Colorado is in the EPA's "Region 8," which includes Montana, the Dakotas, Wyoming and Utah. The amount of waste produced in the region is going down. The data from these states is dominated by metal mines that produce tons of byproducts.
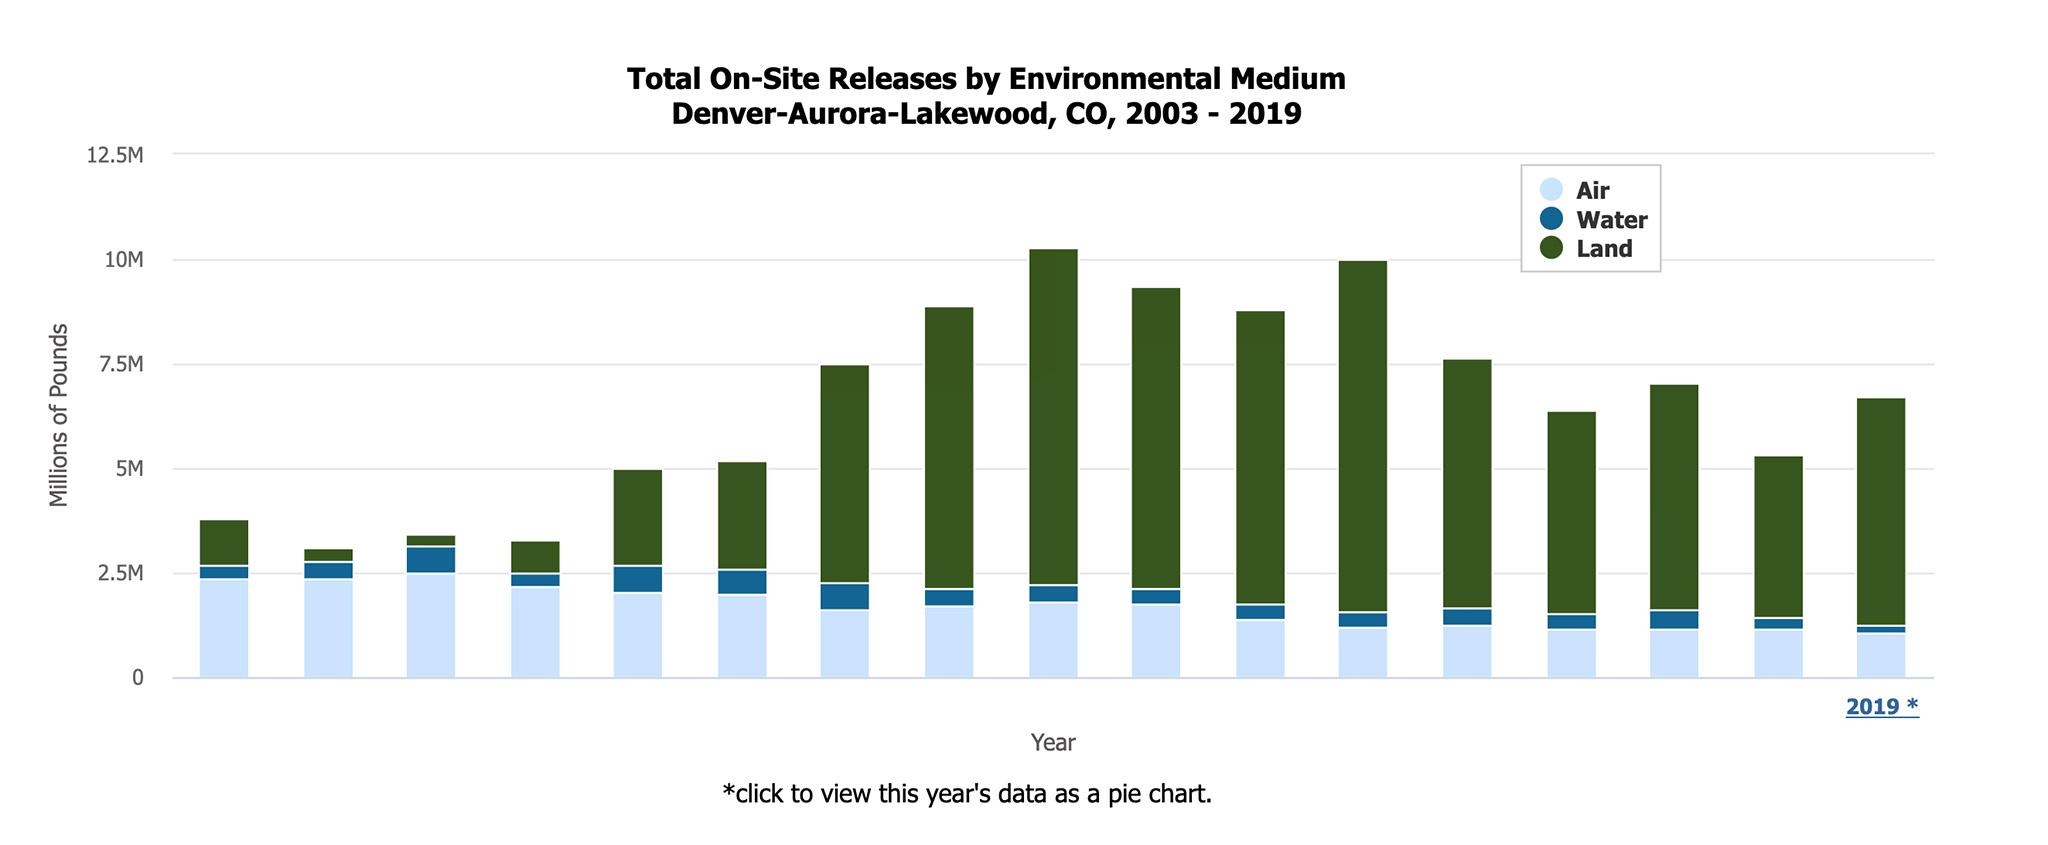
The EPA's website contains data specific to what it calls the "Denver-Aurora-Lakewood" area, which stretches from the foothills into the eastern plains. The two biggest waste producers in this area are on the region's eastern and western extremes: a molybdenum mine in Empire and a hazardous waste cleanup company in Deer Trail. Like Region 8 overall, data on toxic waste locally is heavily influenced by a few weighty sites.
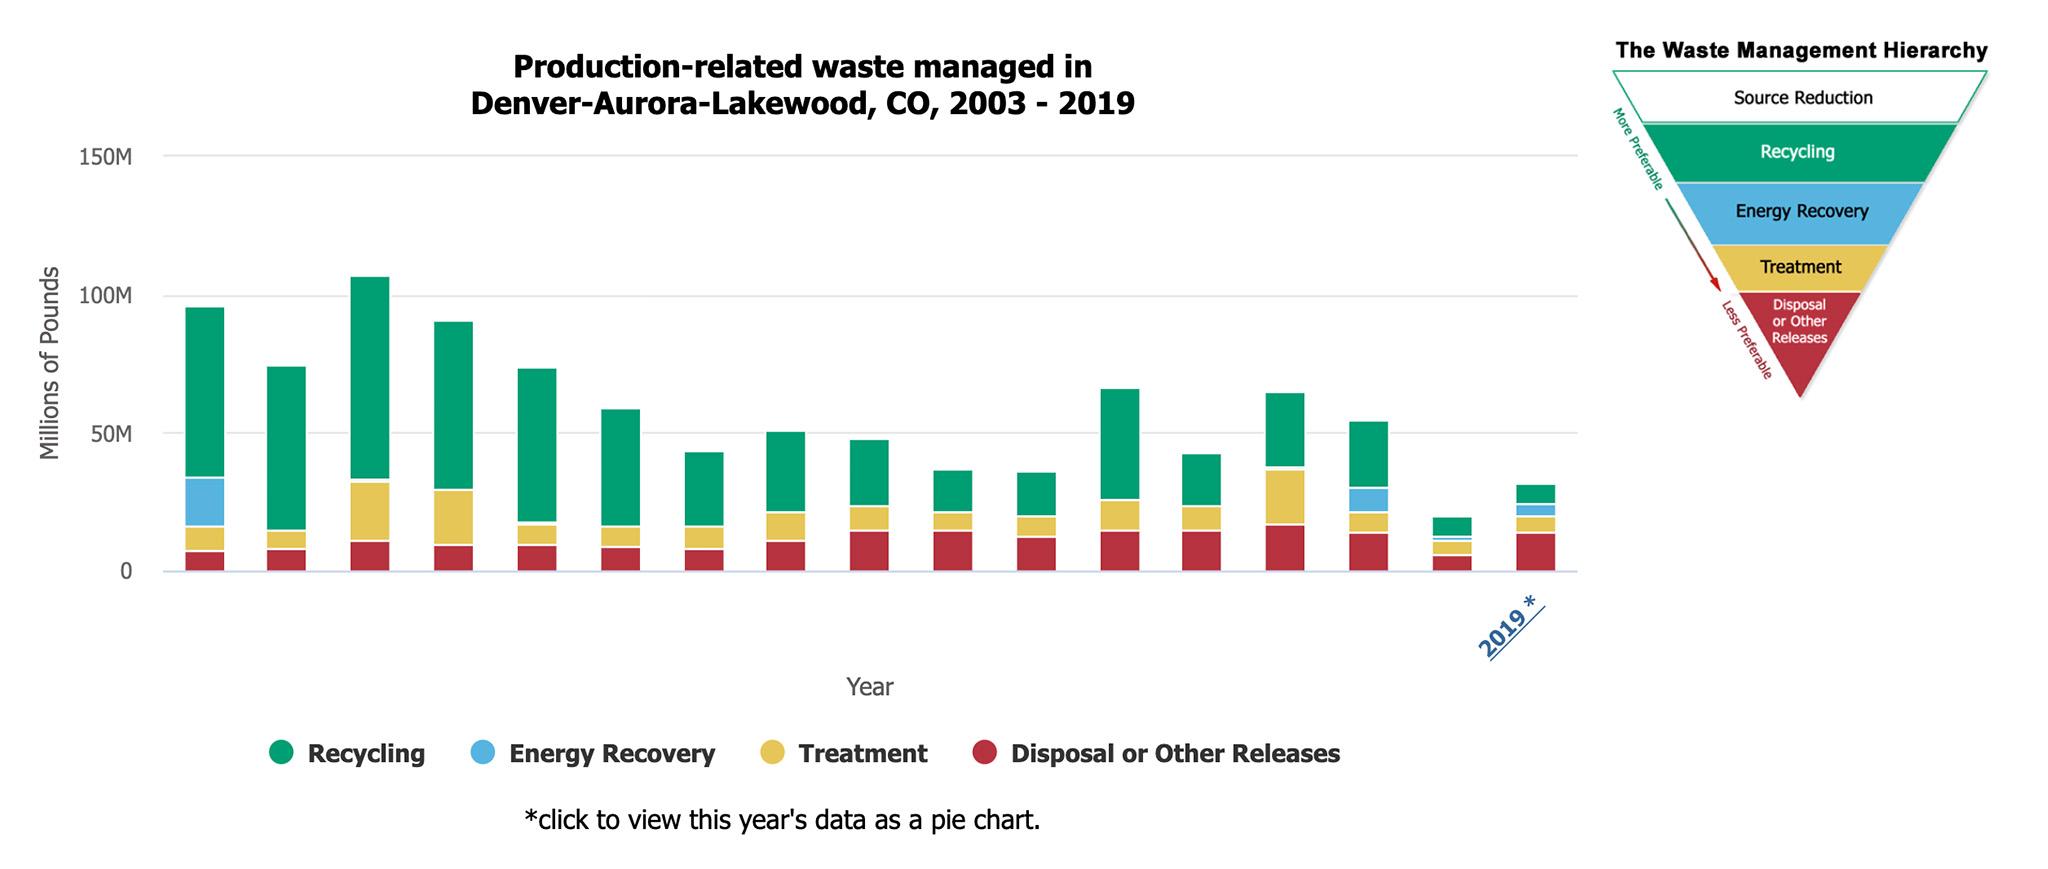
According to the EPA, more than 32 million pounds of industrial waste were recycled, treated, recovered, disposed or released in 2019 in the Denver-Aurora-Lakewood region. That's more than 2018, but it's lower compared to other years in the last decade.
Waste released onsite, be it into a landfill or into air and water, followed a similar trend. The 2019 totals were up from 2018's but were still lower than data reported from 2009 to 2015. Chemicals released into the air for this region were lower in 2019 than at any time in the last decade.
Now, let's drill down to the metro level.
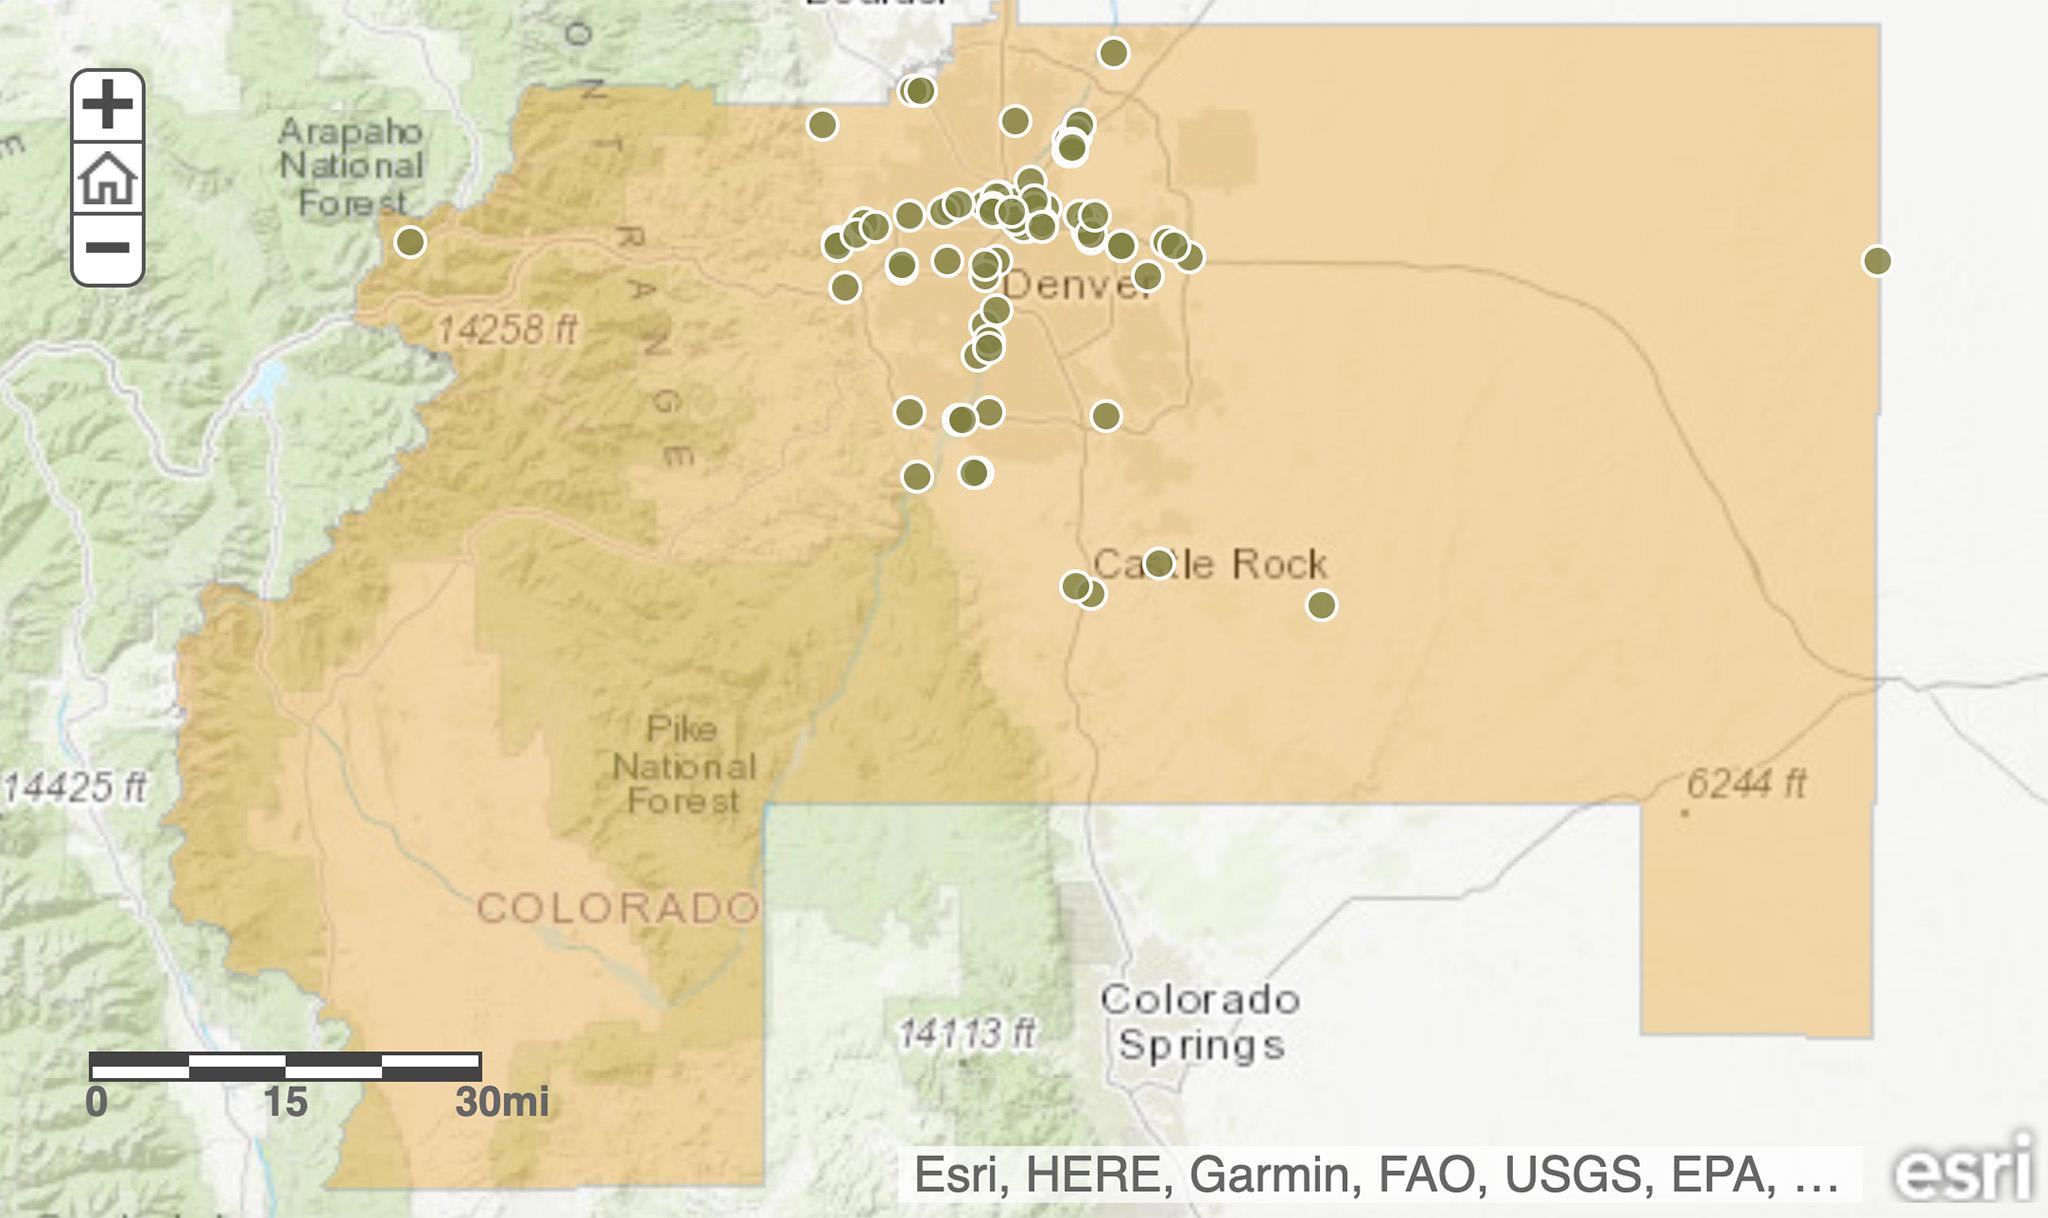
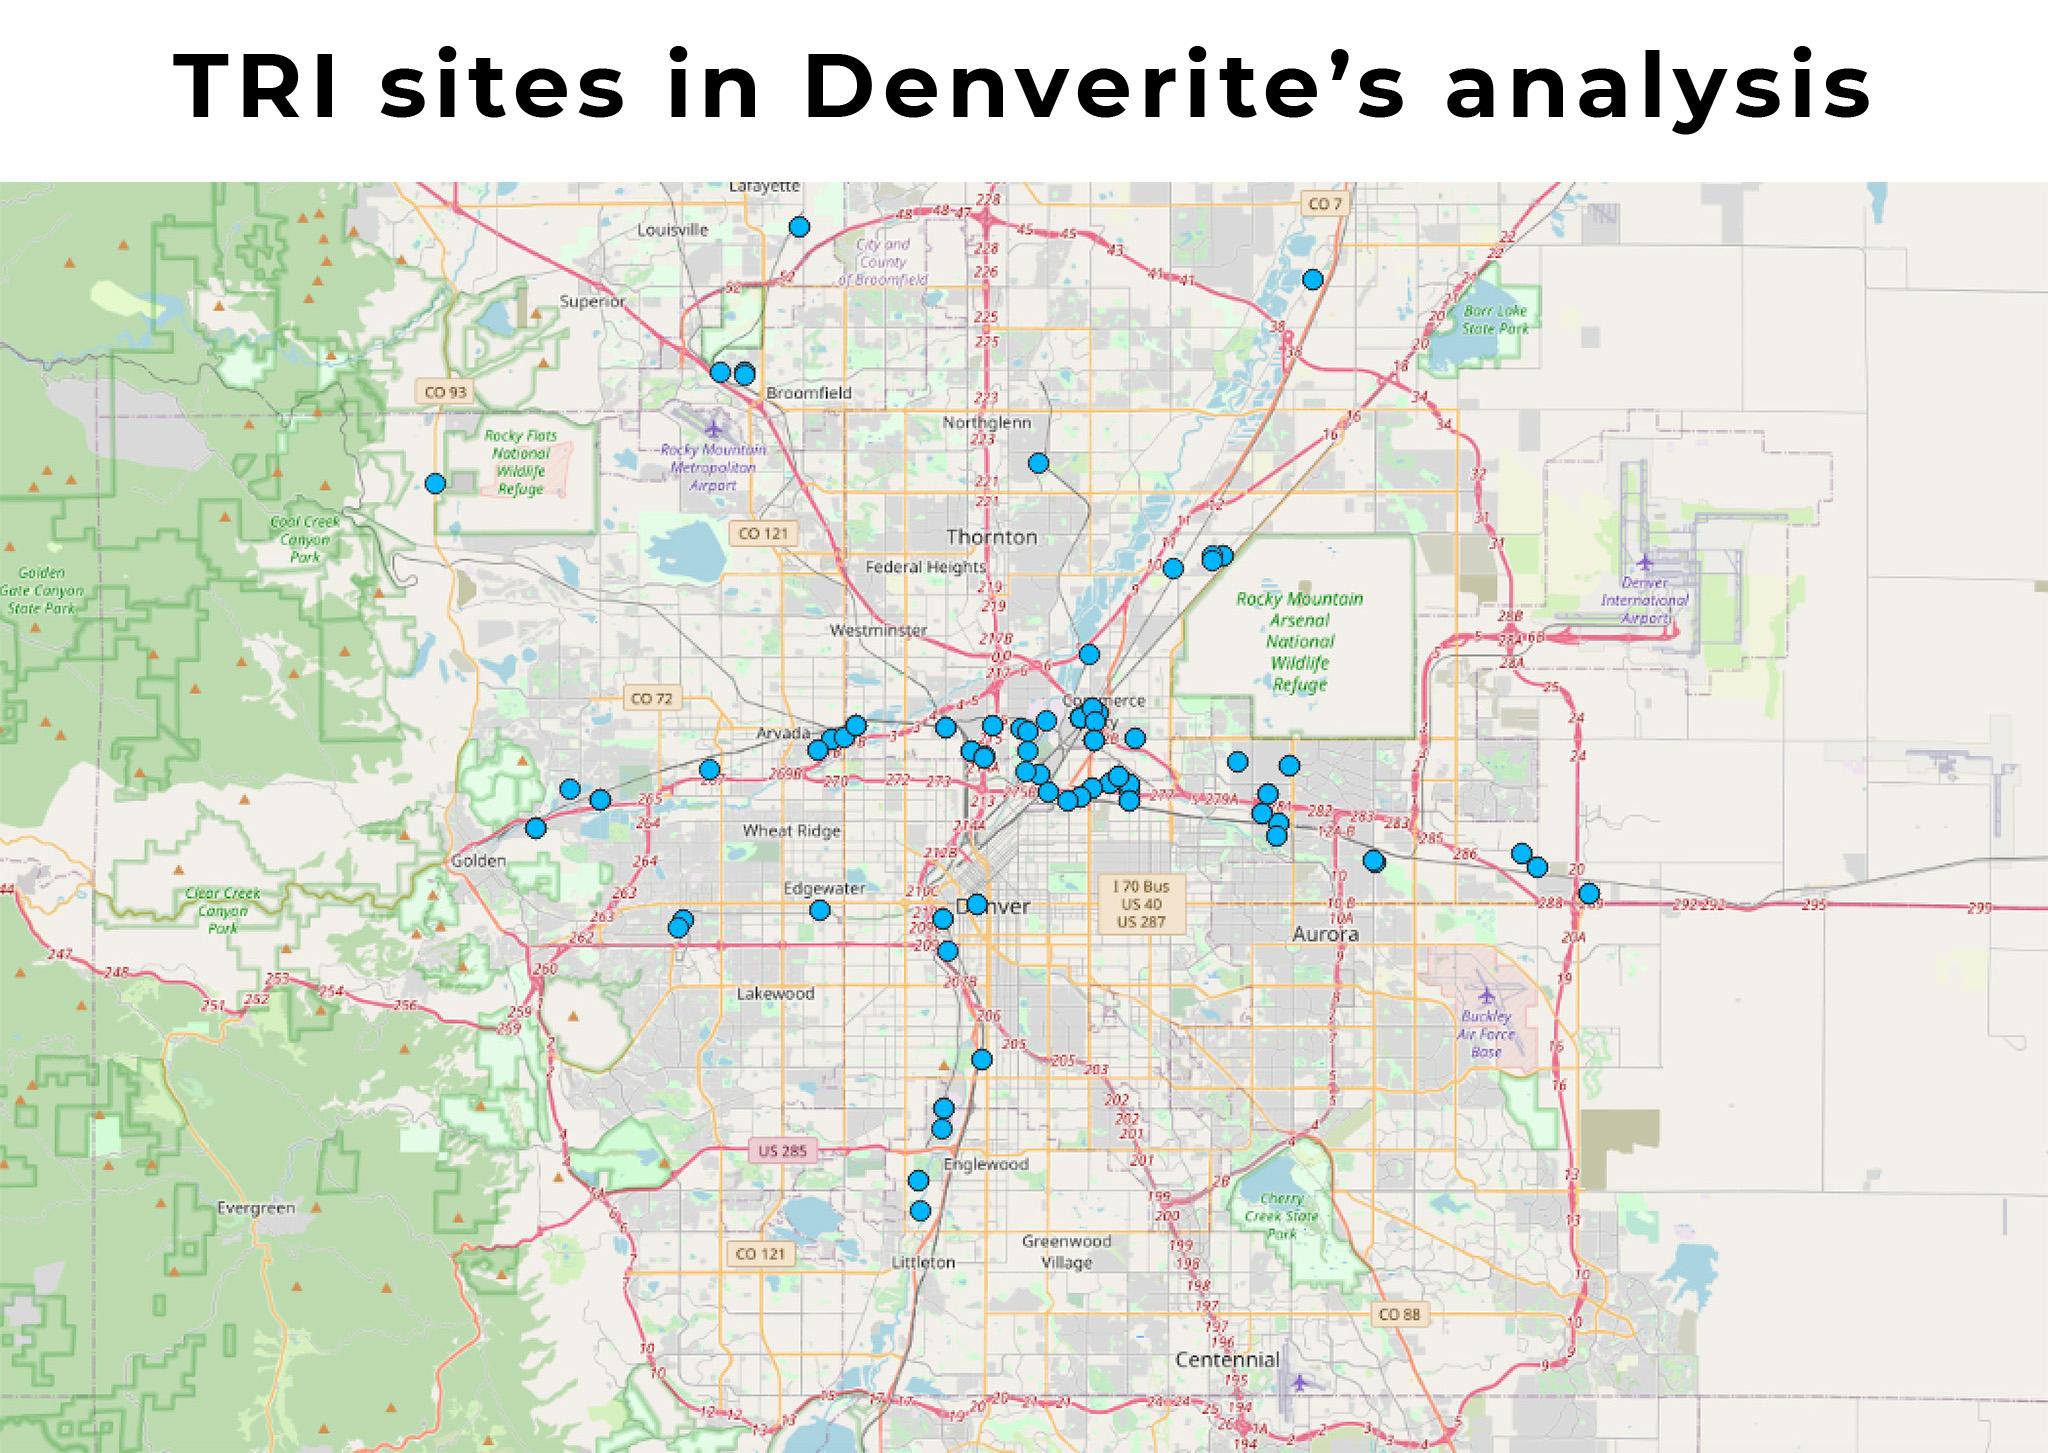
To really understand what's happening in town, we selected sites that were inside or just beyond the I-470 beltway around Denver. It's a little arbitrary, but we felt like this was a decent boundary that filtered out less relevant operations.
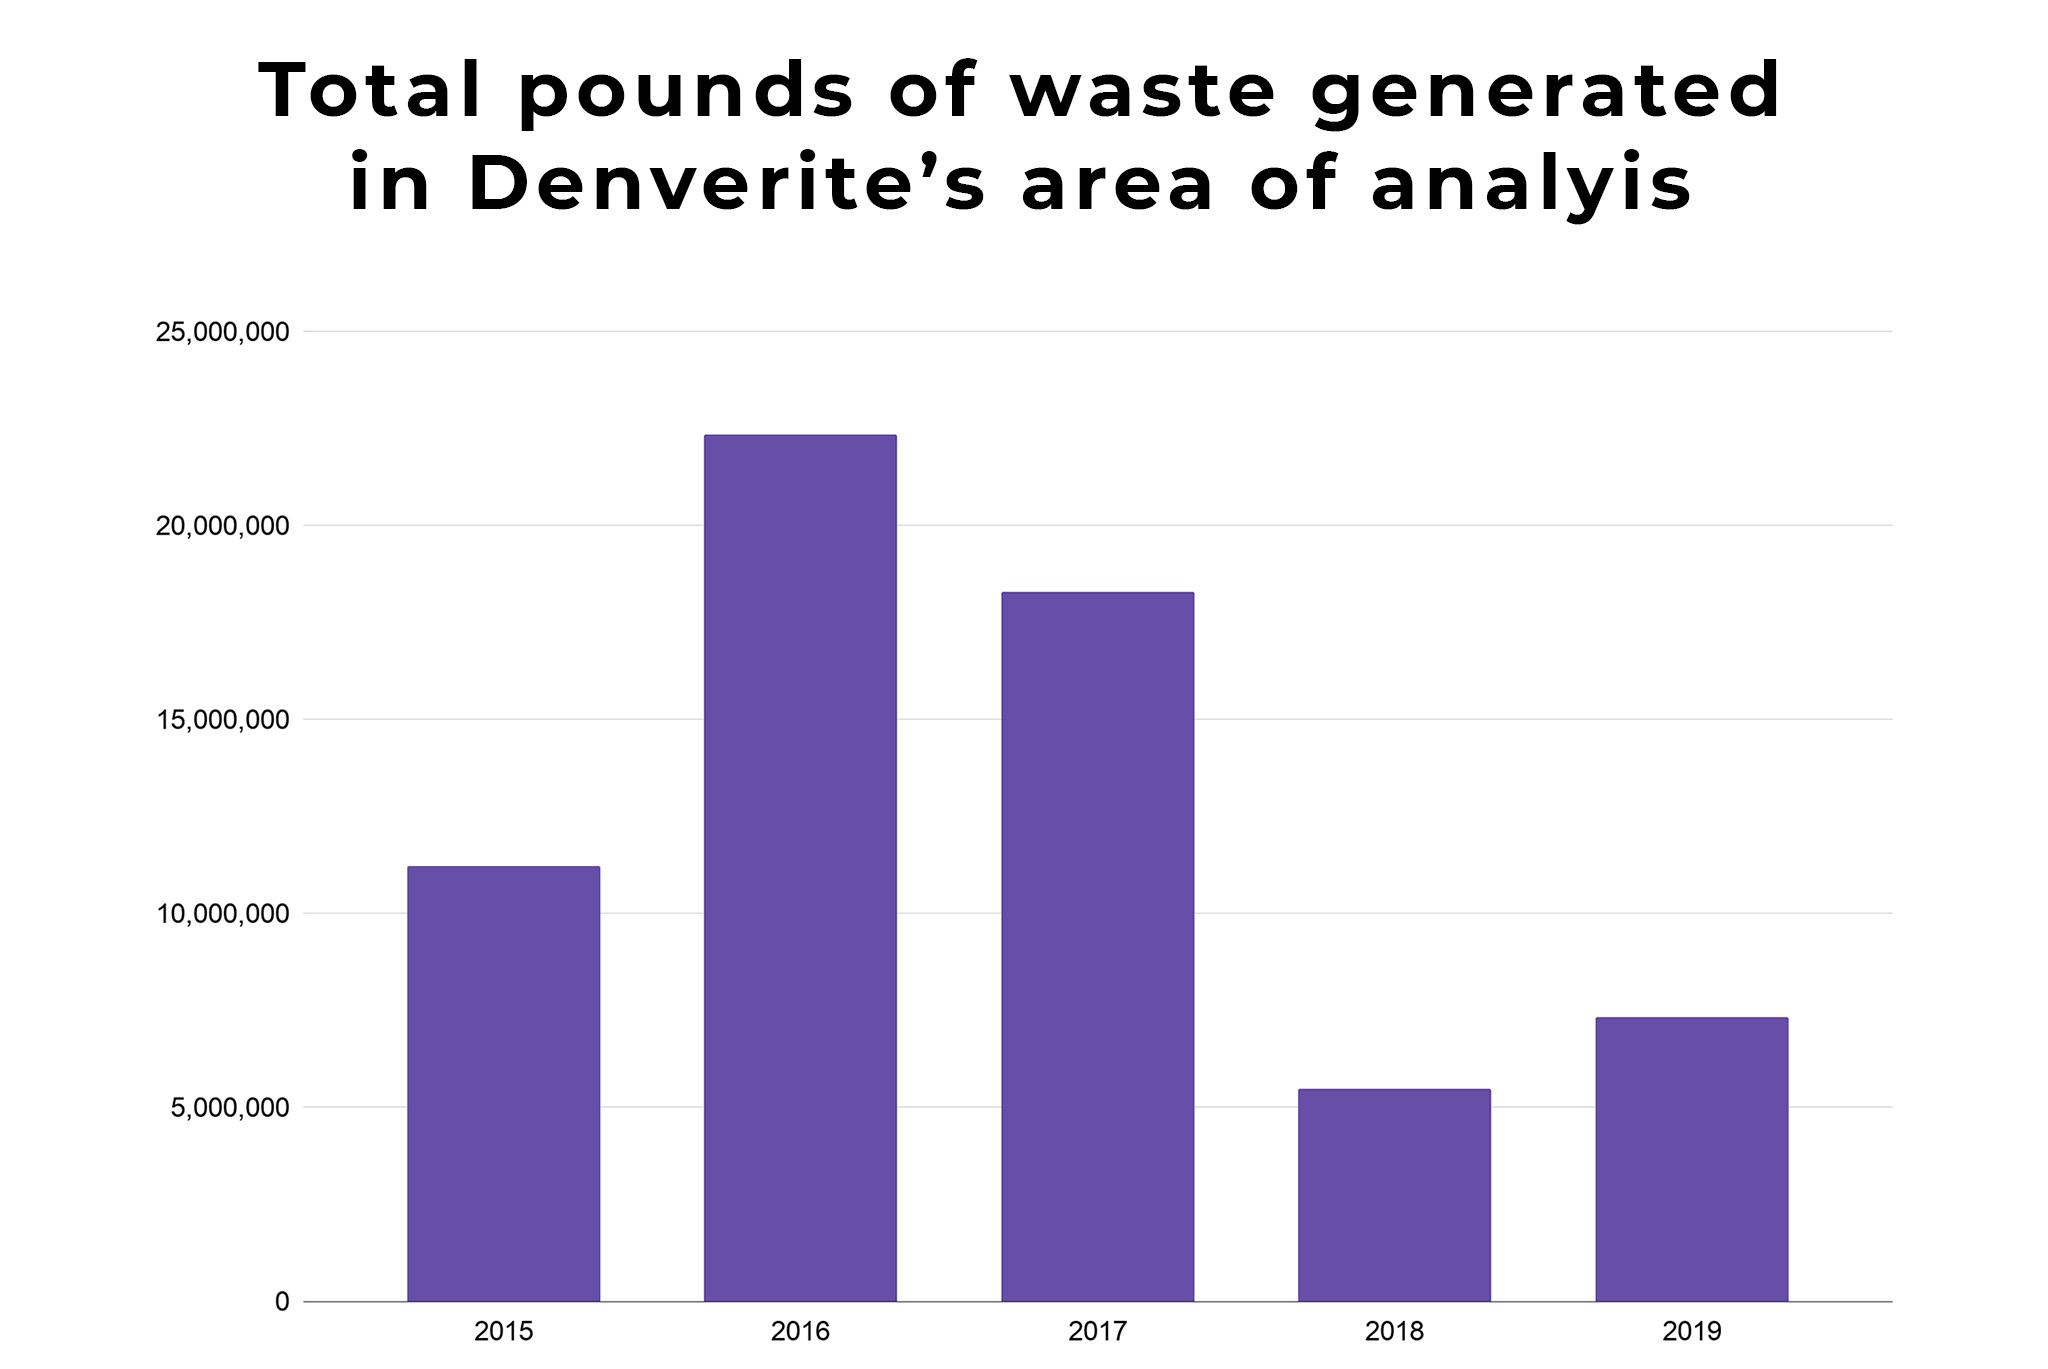
The total poundage of industrial waste generated at these sites follows other trends the EPA reported for Denver-Aurora-Lakewood. Numbers from 2019 were higher than in 2018, but both 2019 and 2018 were lower than previous years.
But unlike the broader sub region, the industrial operations we analyzed did not report fewer pounds of chemicals released into the air onsite in 2019. In fact, 2019 saw the most air releases in the last five years. Releases into water, on the other hand, were the lowest since 2015.
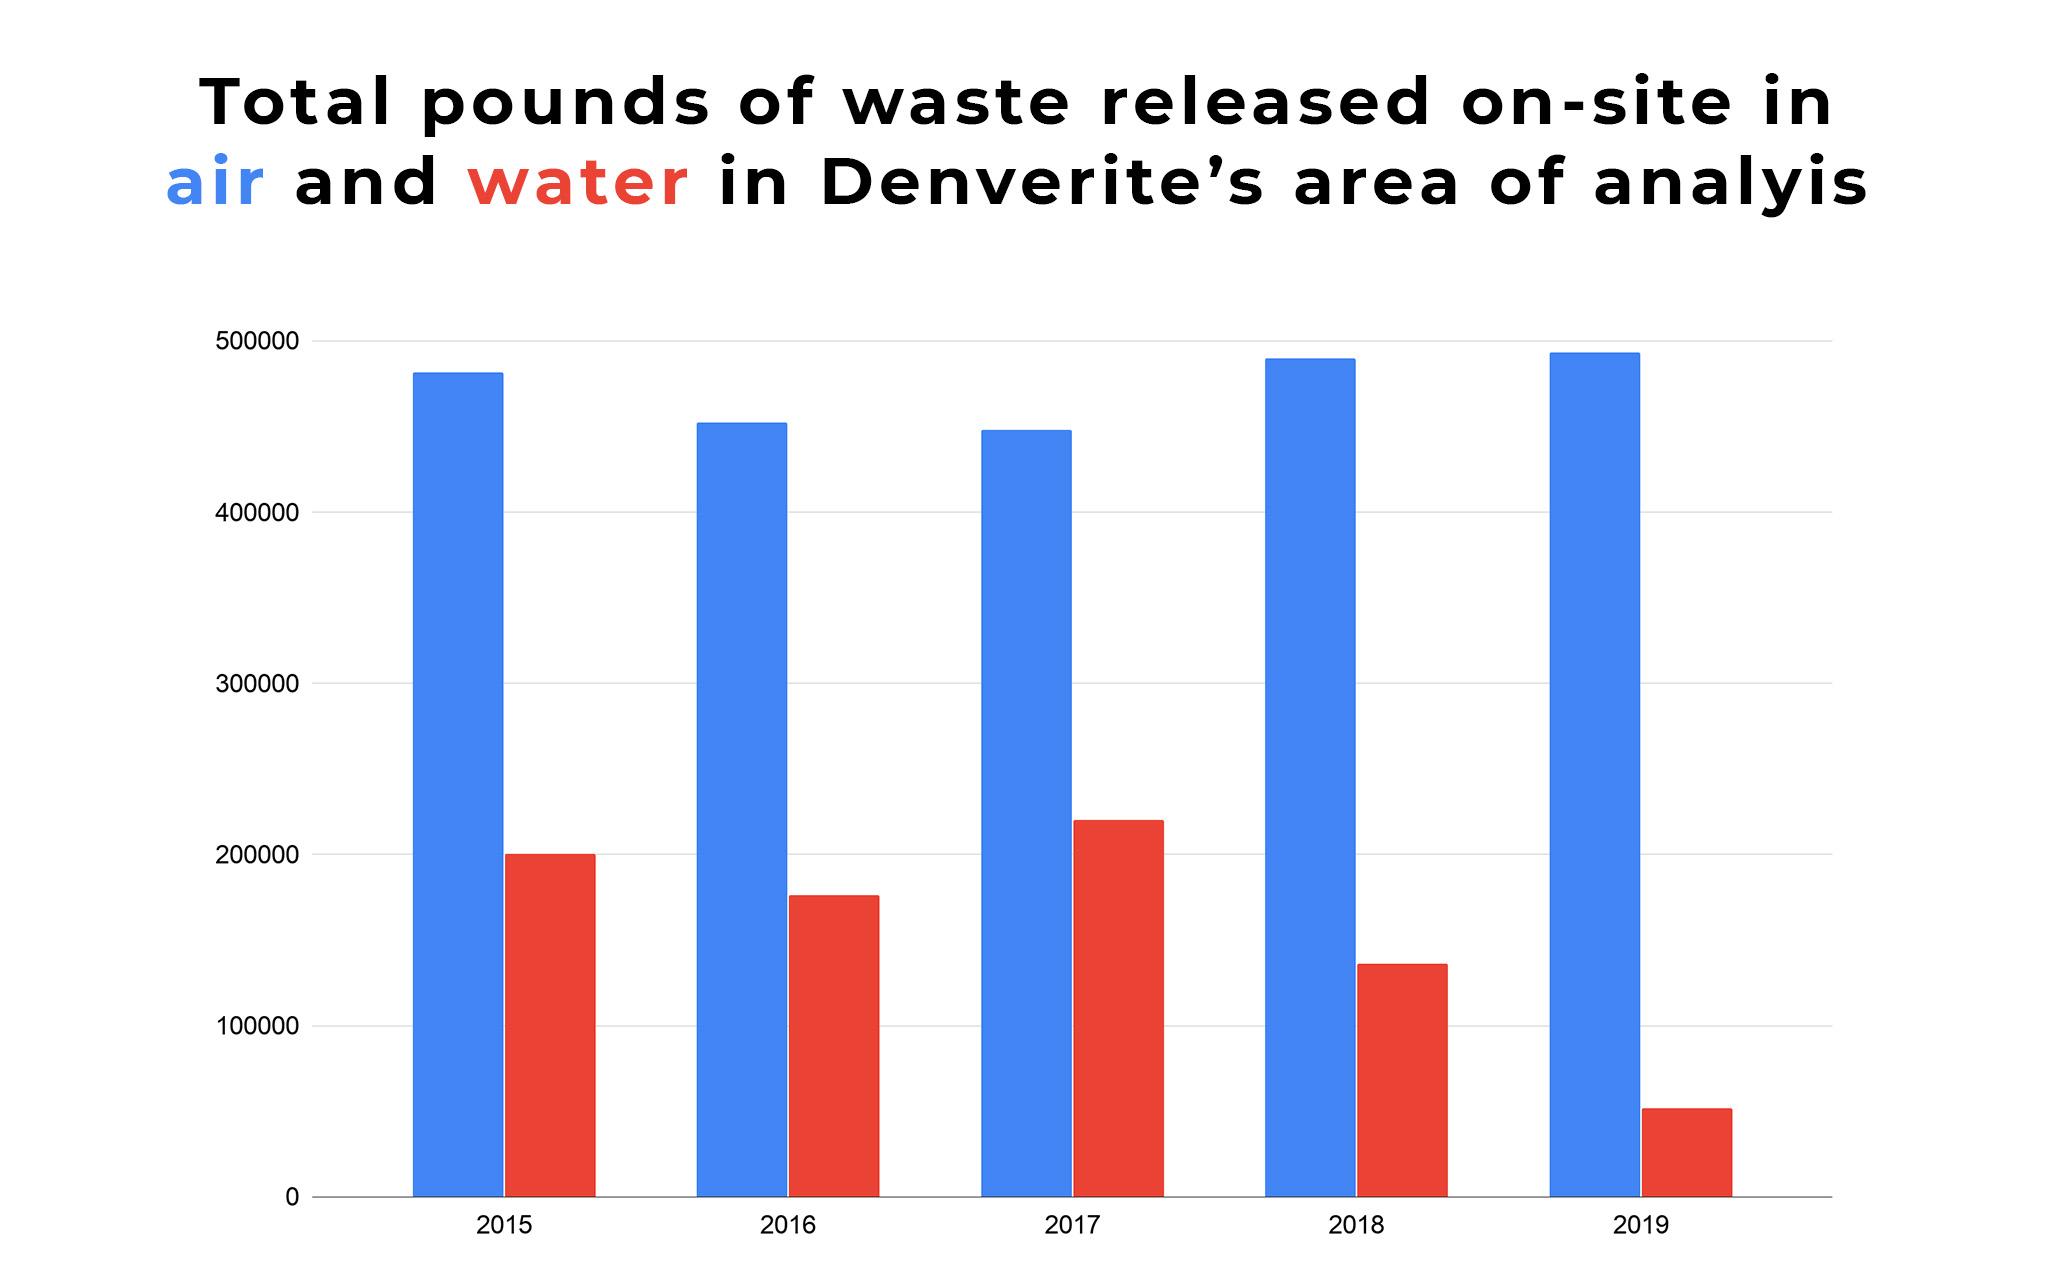
Again, it's important to remember that these numbers don't indicate health impacts. Andrew Bare, spokesperson for the Colorado Department of Public Health and Environment, told us industrial operations might report more air emissions because they're purposely diluting chemicals. They may increase the volume of emissions to decrease a given chemical's concentration, specifically to reduce the possibility that they could cause harm.
Zooming in even more, let's take a look at which sites were responsible for the most waste.
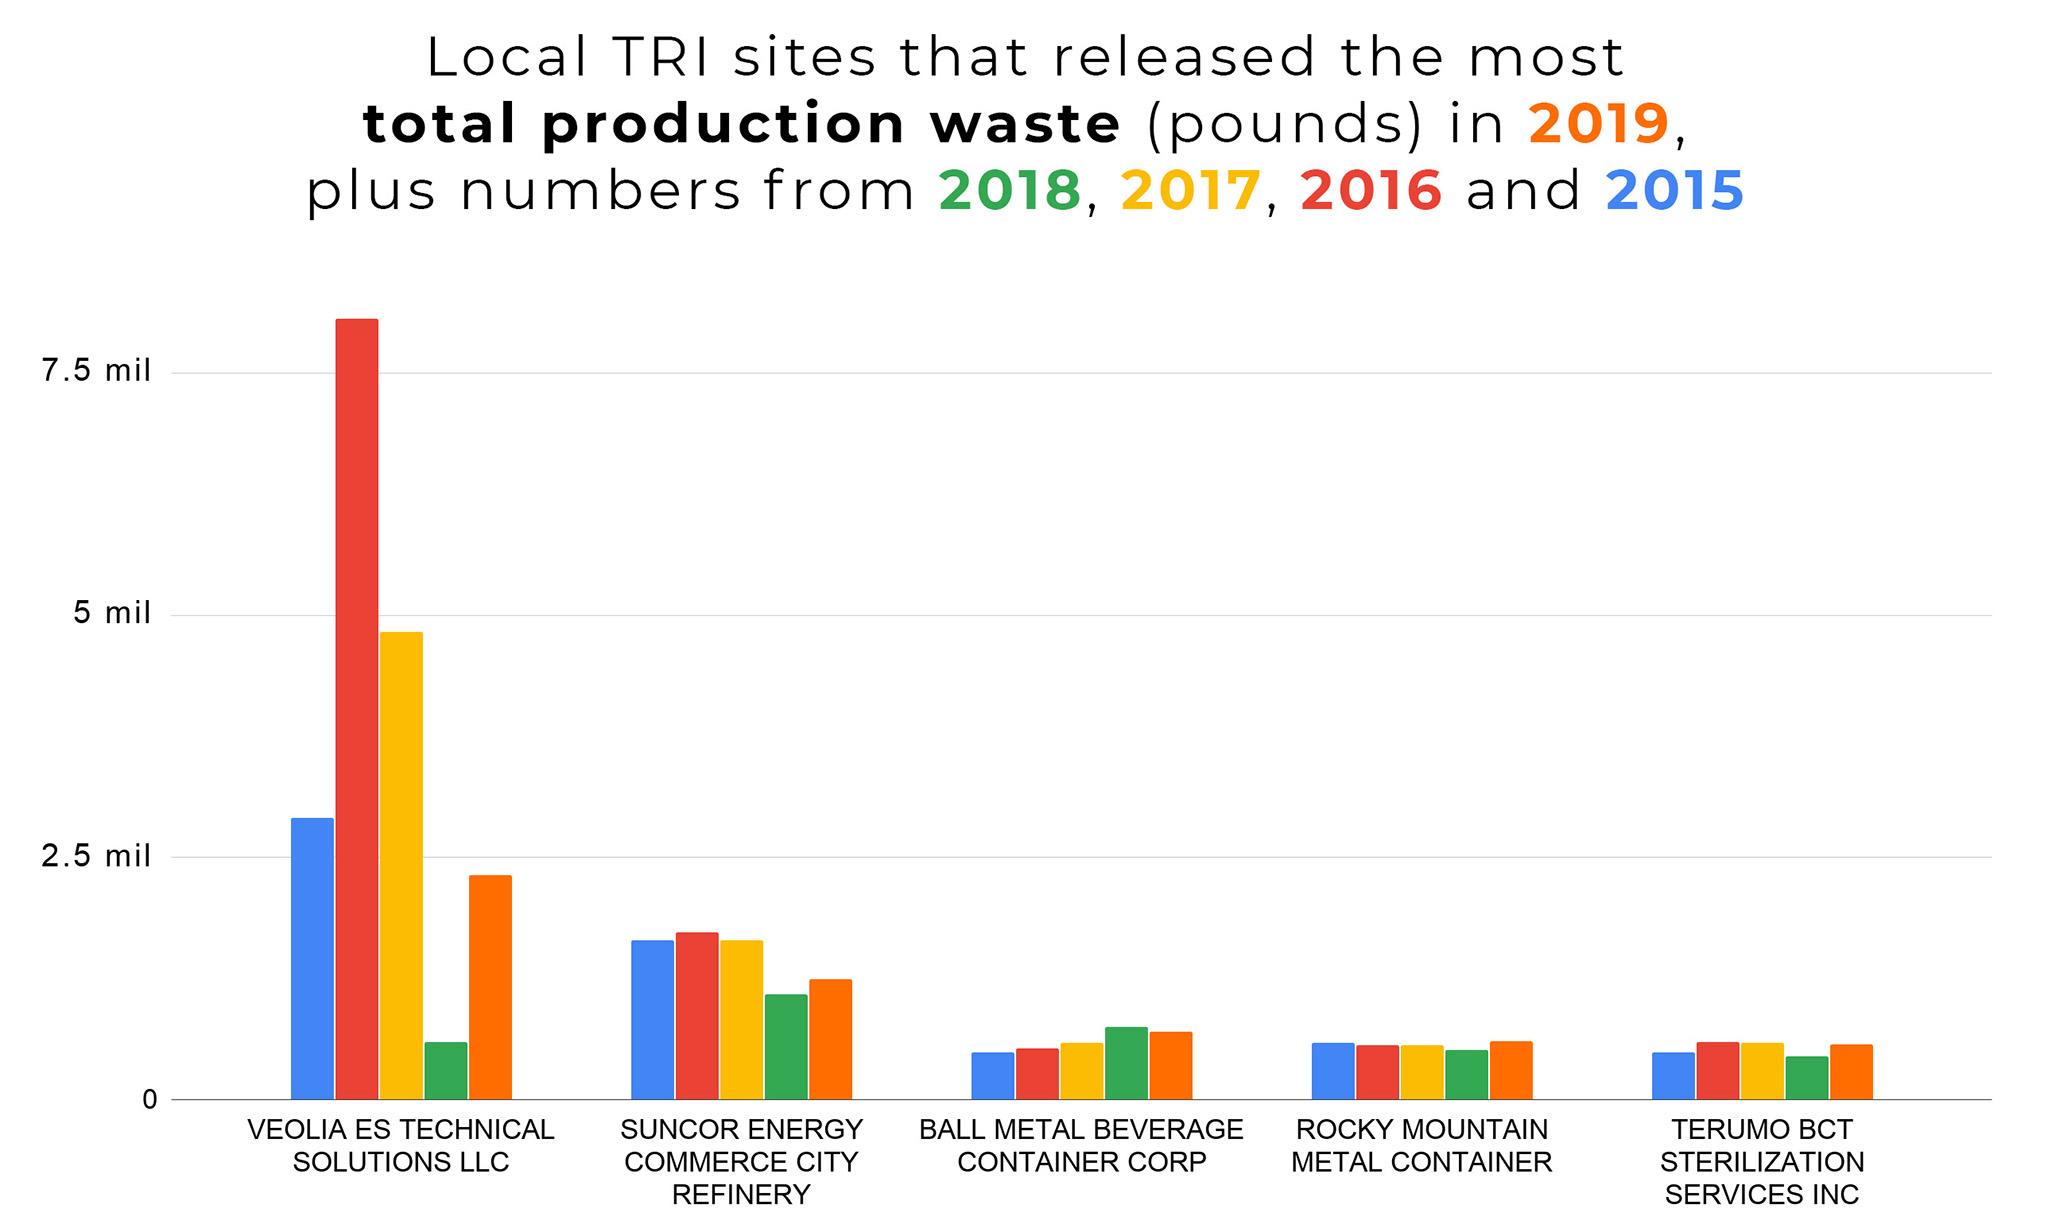
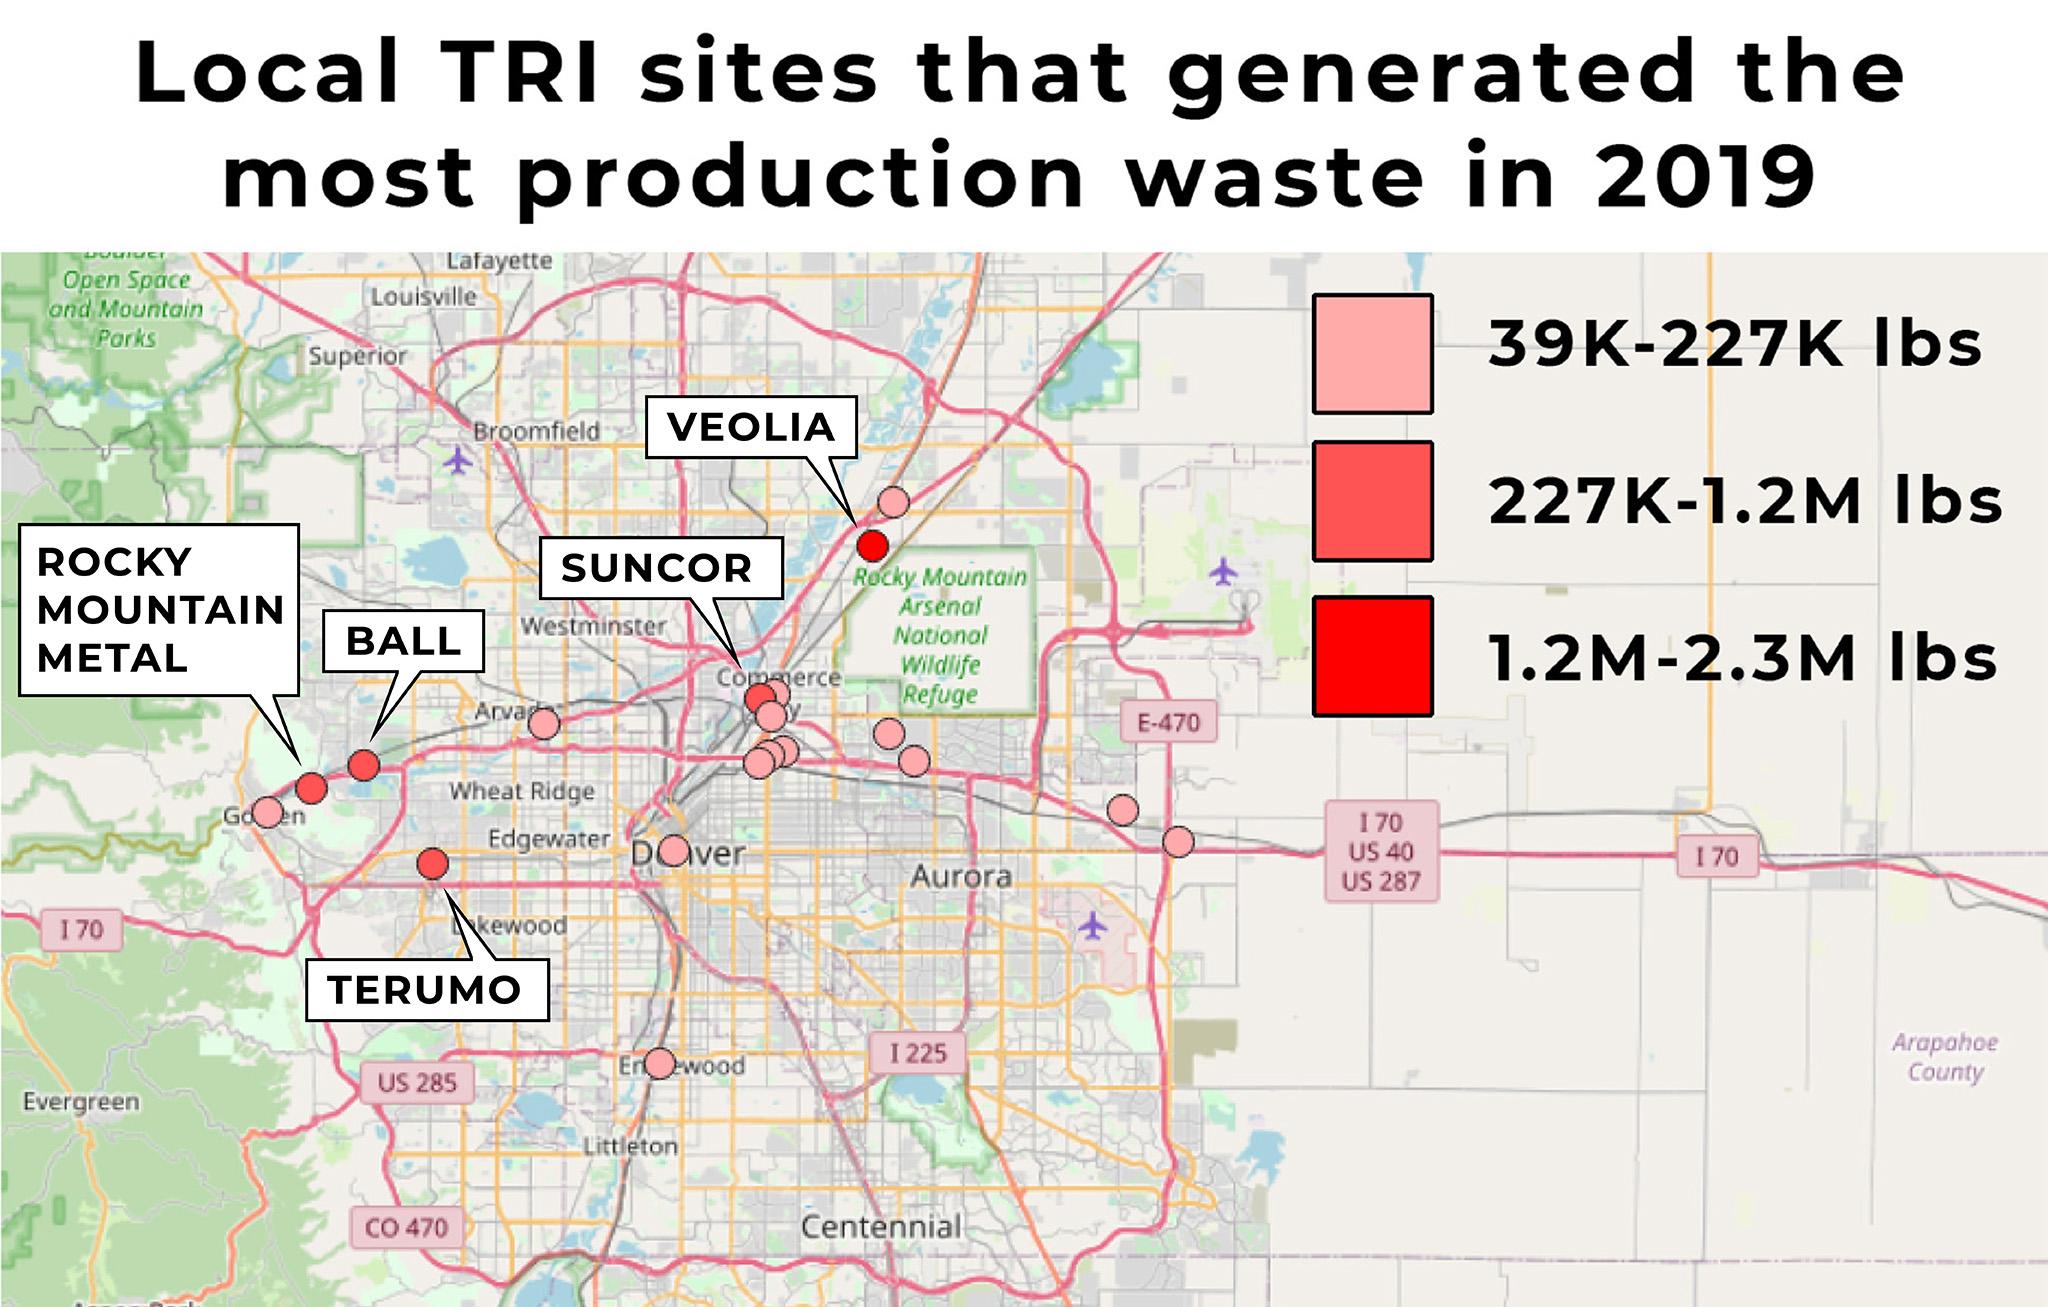
We'll begin with "production waste," which the EPA says is the total weight of solids, liquids and gasses produced as part of industrial processes. Remember, some of this is trucked off to landfills, some is recycled, and some is released into air and water. Below are the five facilities that generated the most waste as part of their regular operation in 2019, plus figures from the previous four years.
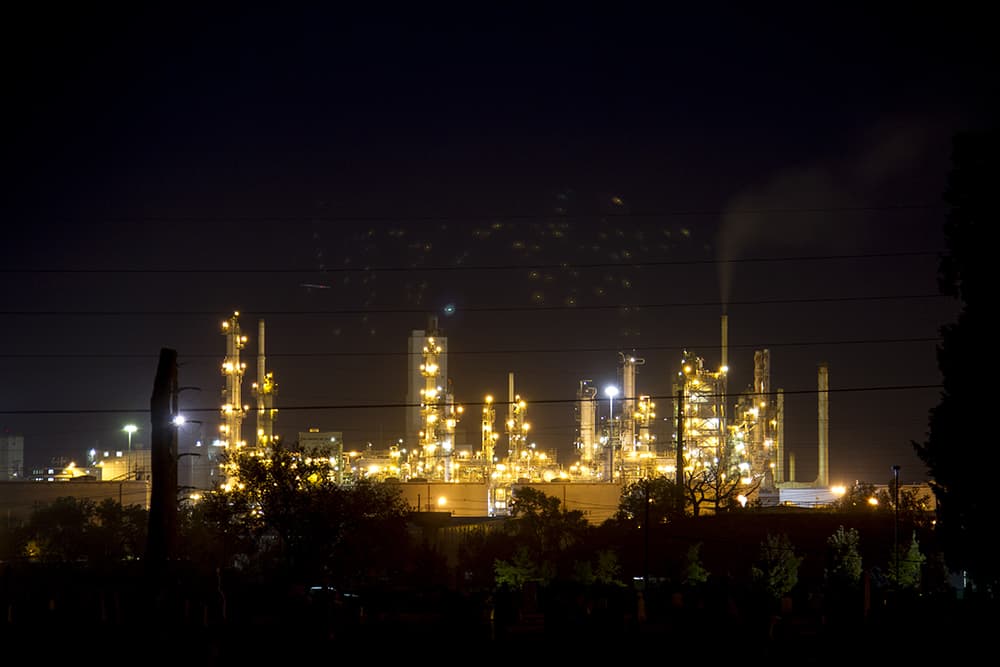
The top producer, Veolia North American, treats and stores chemicals. The second largest, Suncor Energy, is the state's only oil refinery. Behind it is Ball Metal Beverage Container Corp, which makes glass jars - and recently got the naming rights to the arena formerly known as the Pepsi Center. A close fourth, Rocky Mountain Metal Container cans Coors beer and other Molson Coors products. Finally, Terumo BCT Sterilization Services processes medical equipment for an international company that makes cell and blood therapies.
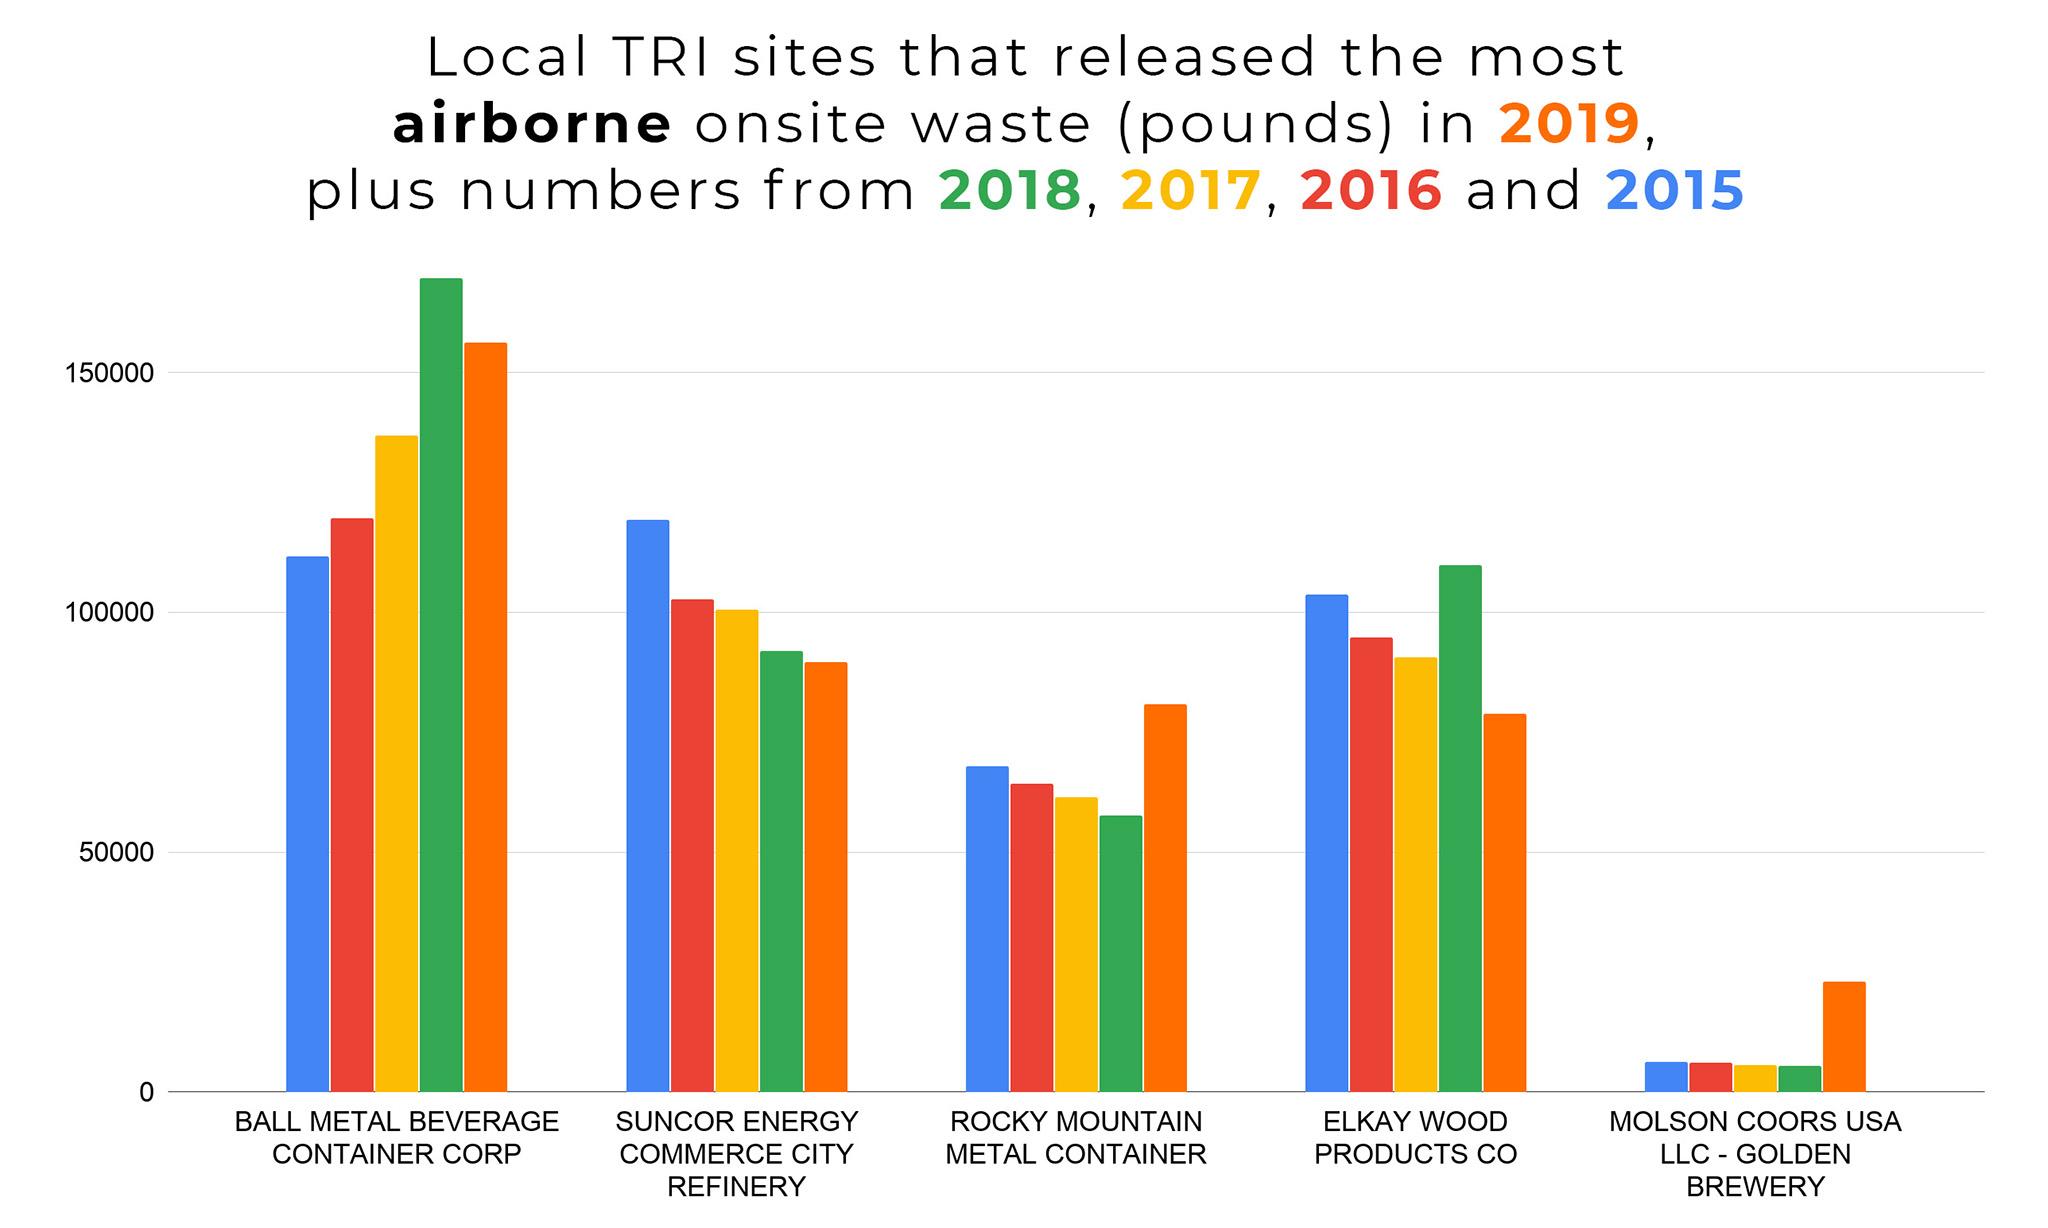
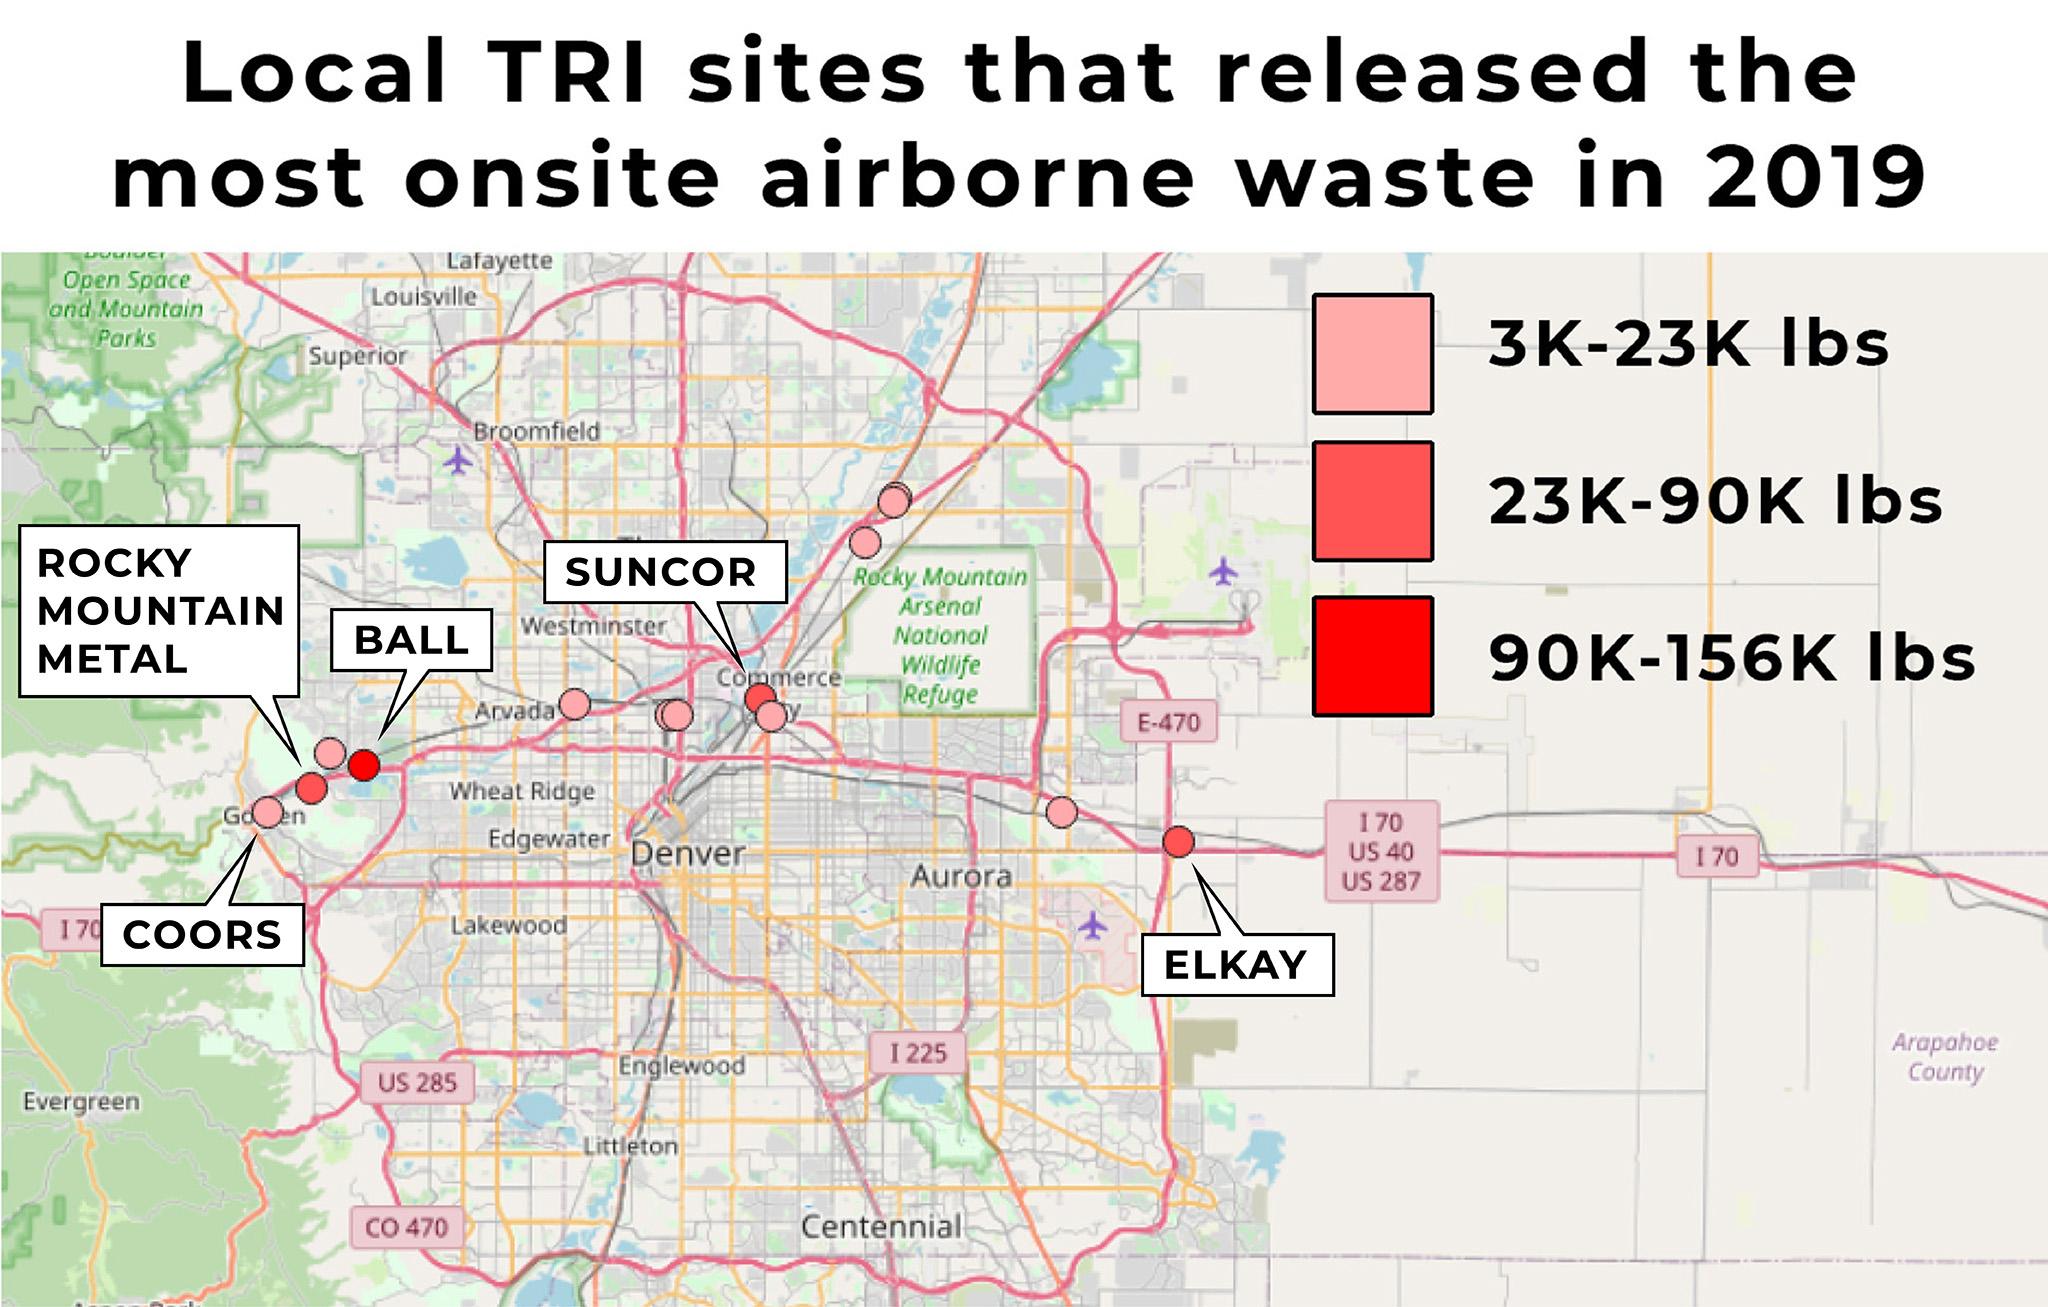
Next, let's take a look at the sites that reported the most air releases in 2019. These numbers are the sum of two columns in the EPA's TRI data: "fugitive" air emissions and "stack" air emissions. "Stack" air is the pounds of material released through smokestacks and ventilation systems, CSU associate professor Howard Ramsdell told us, whereas "fugitive" releases might be viewed as air pollution that's vented out through a window. Ramsdell said the choice to pipe emissions up through a smokestack is mostly about protecting workers. If a company decided to install a system that captures "fugitive" emissions, those releases would be transferred to the "stack" column. We added those columns together to show the total weight of chemicals released into the air at each site.
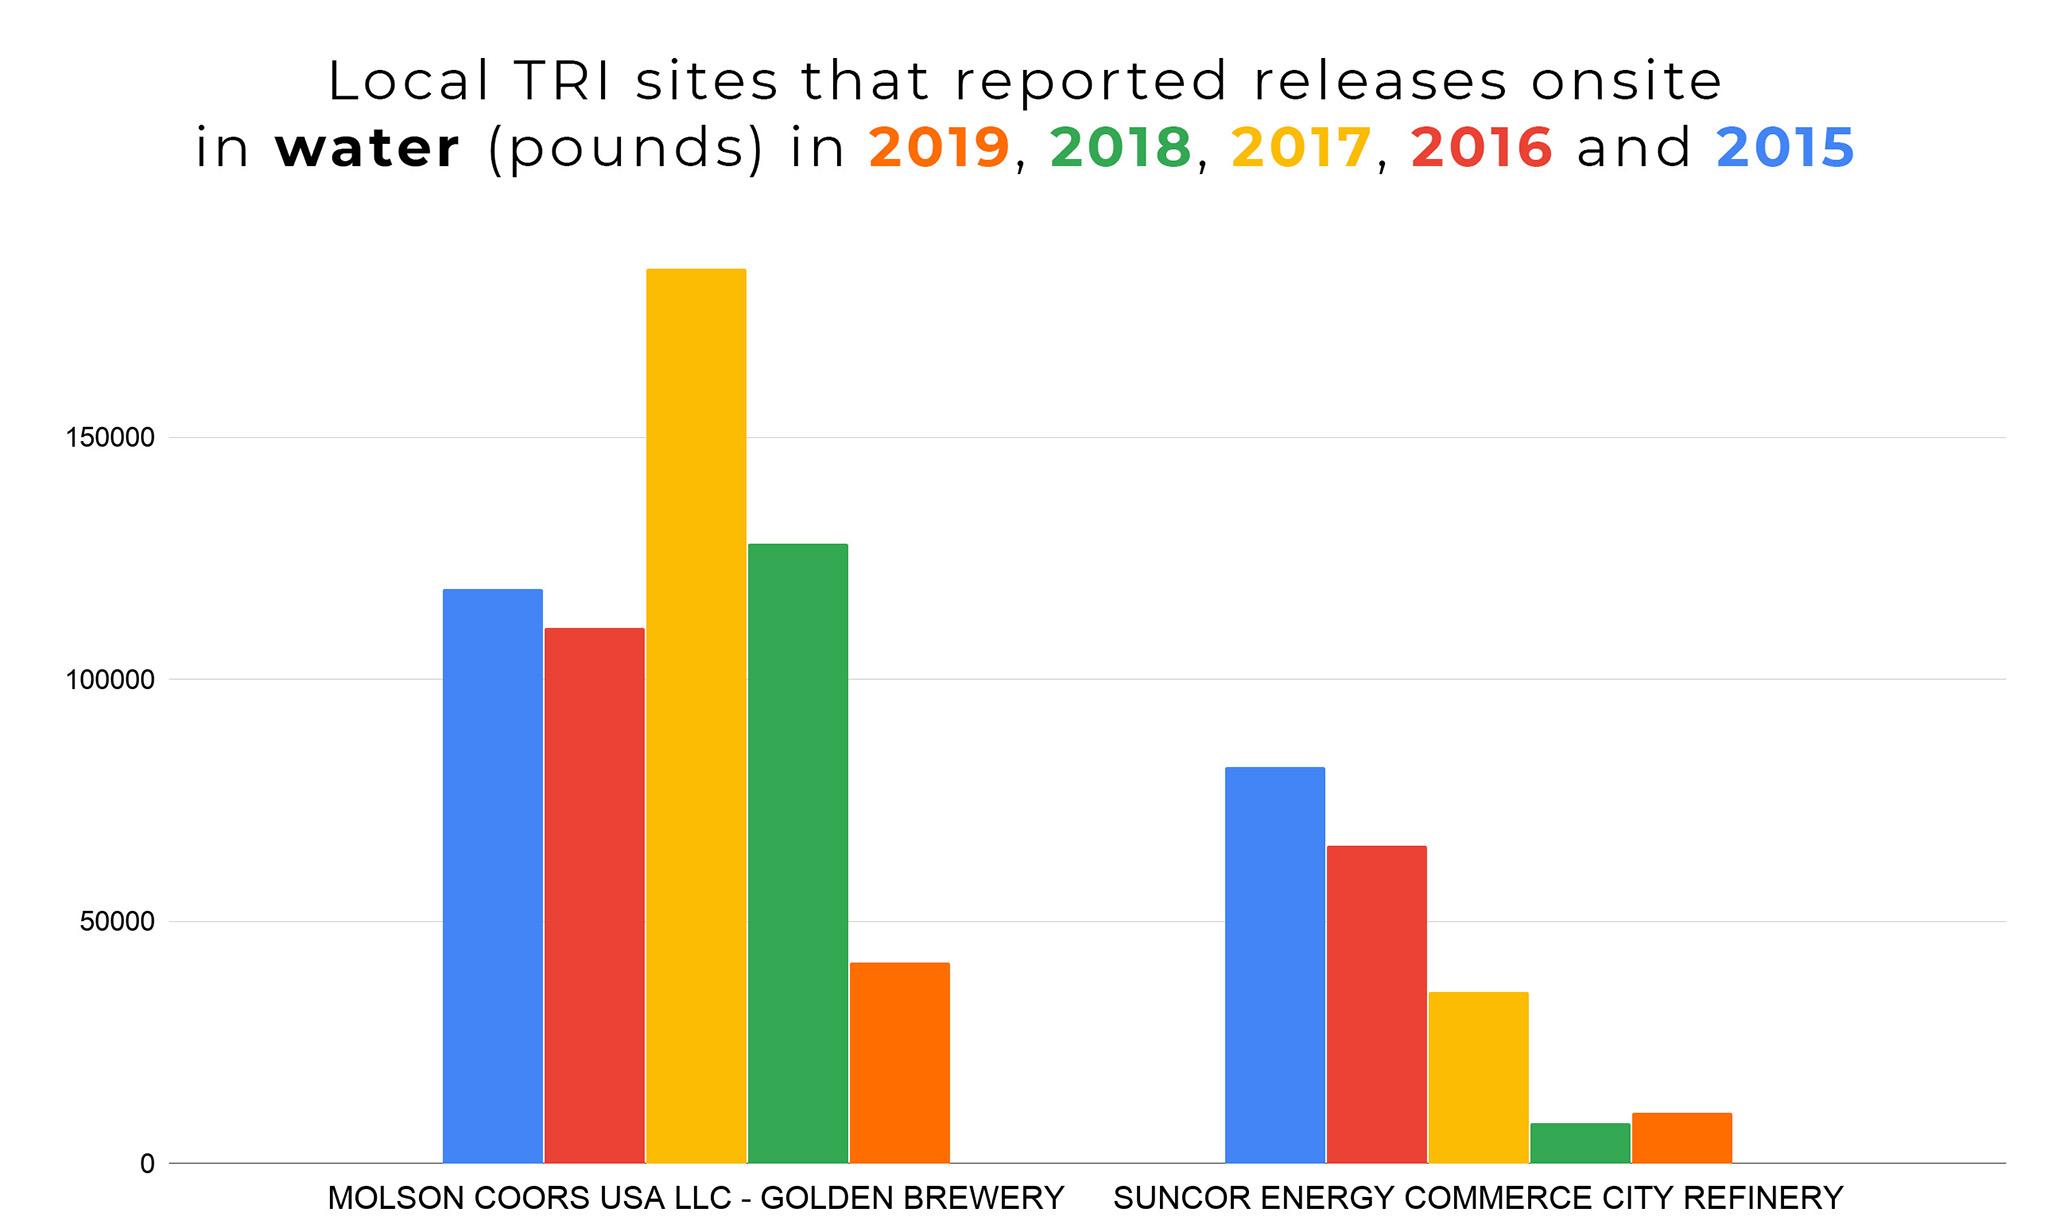
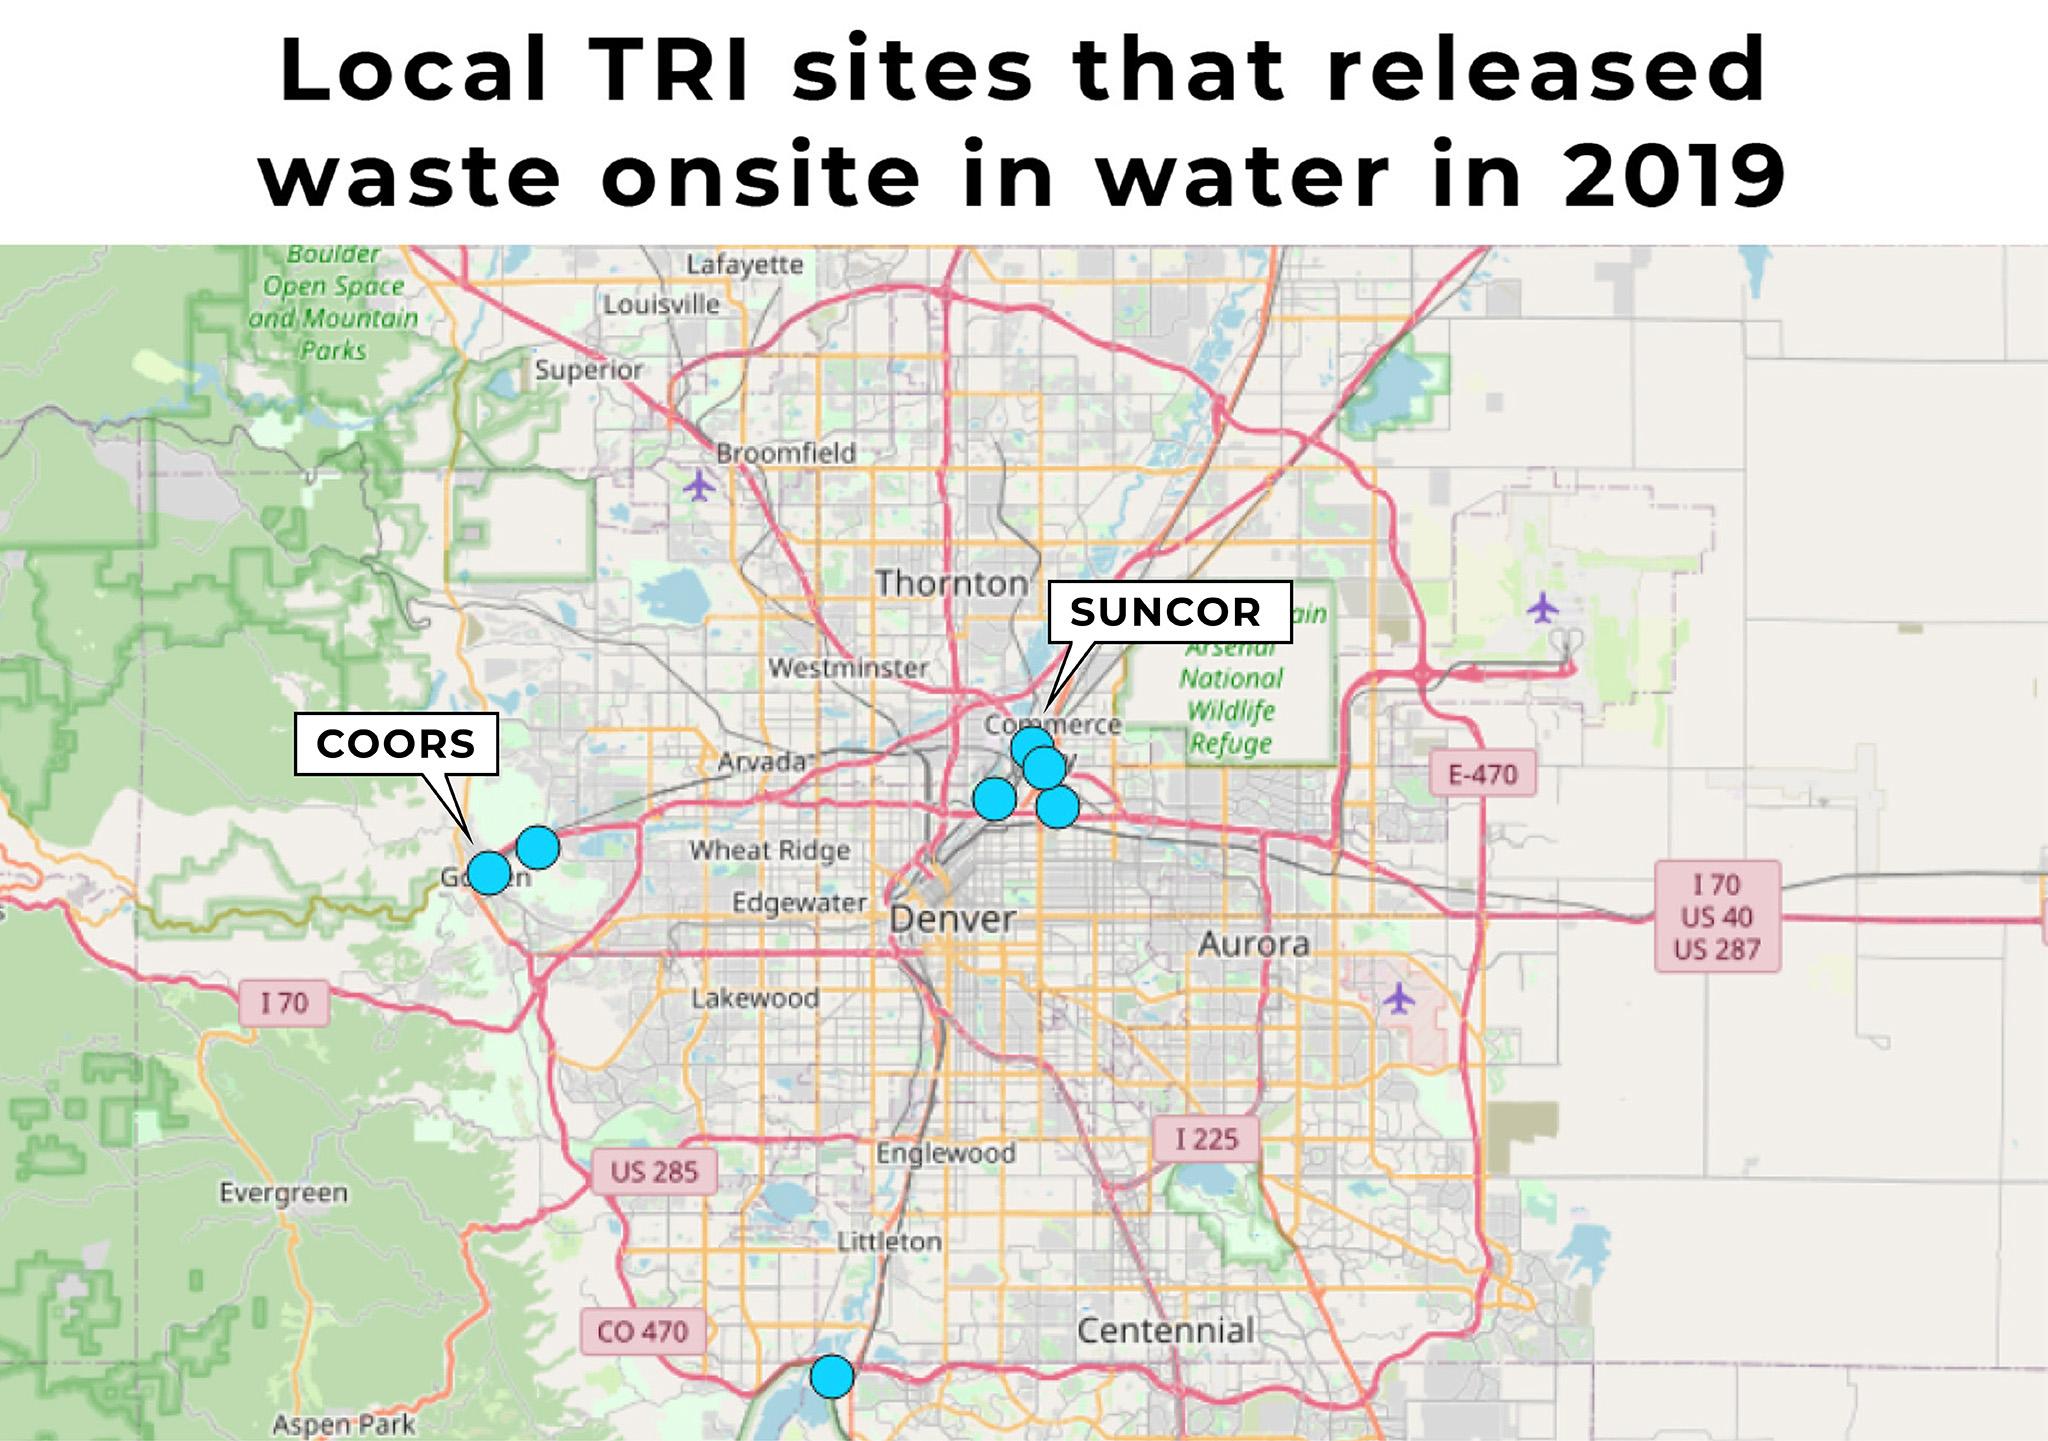
Next up are onsite releases into water. Five companies reported these numbers in 2019. Three said they released one pound of chemicals or less, so they didn't appear in our charts.
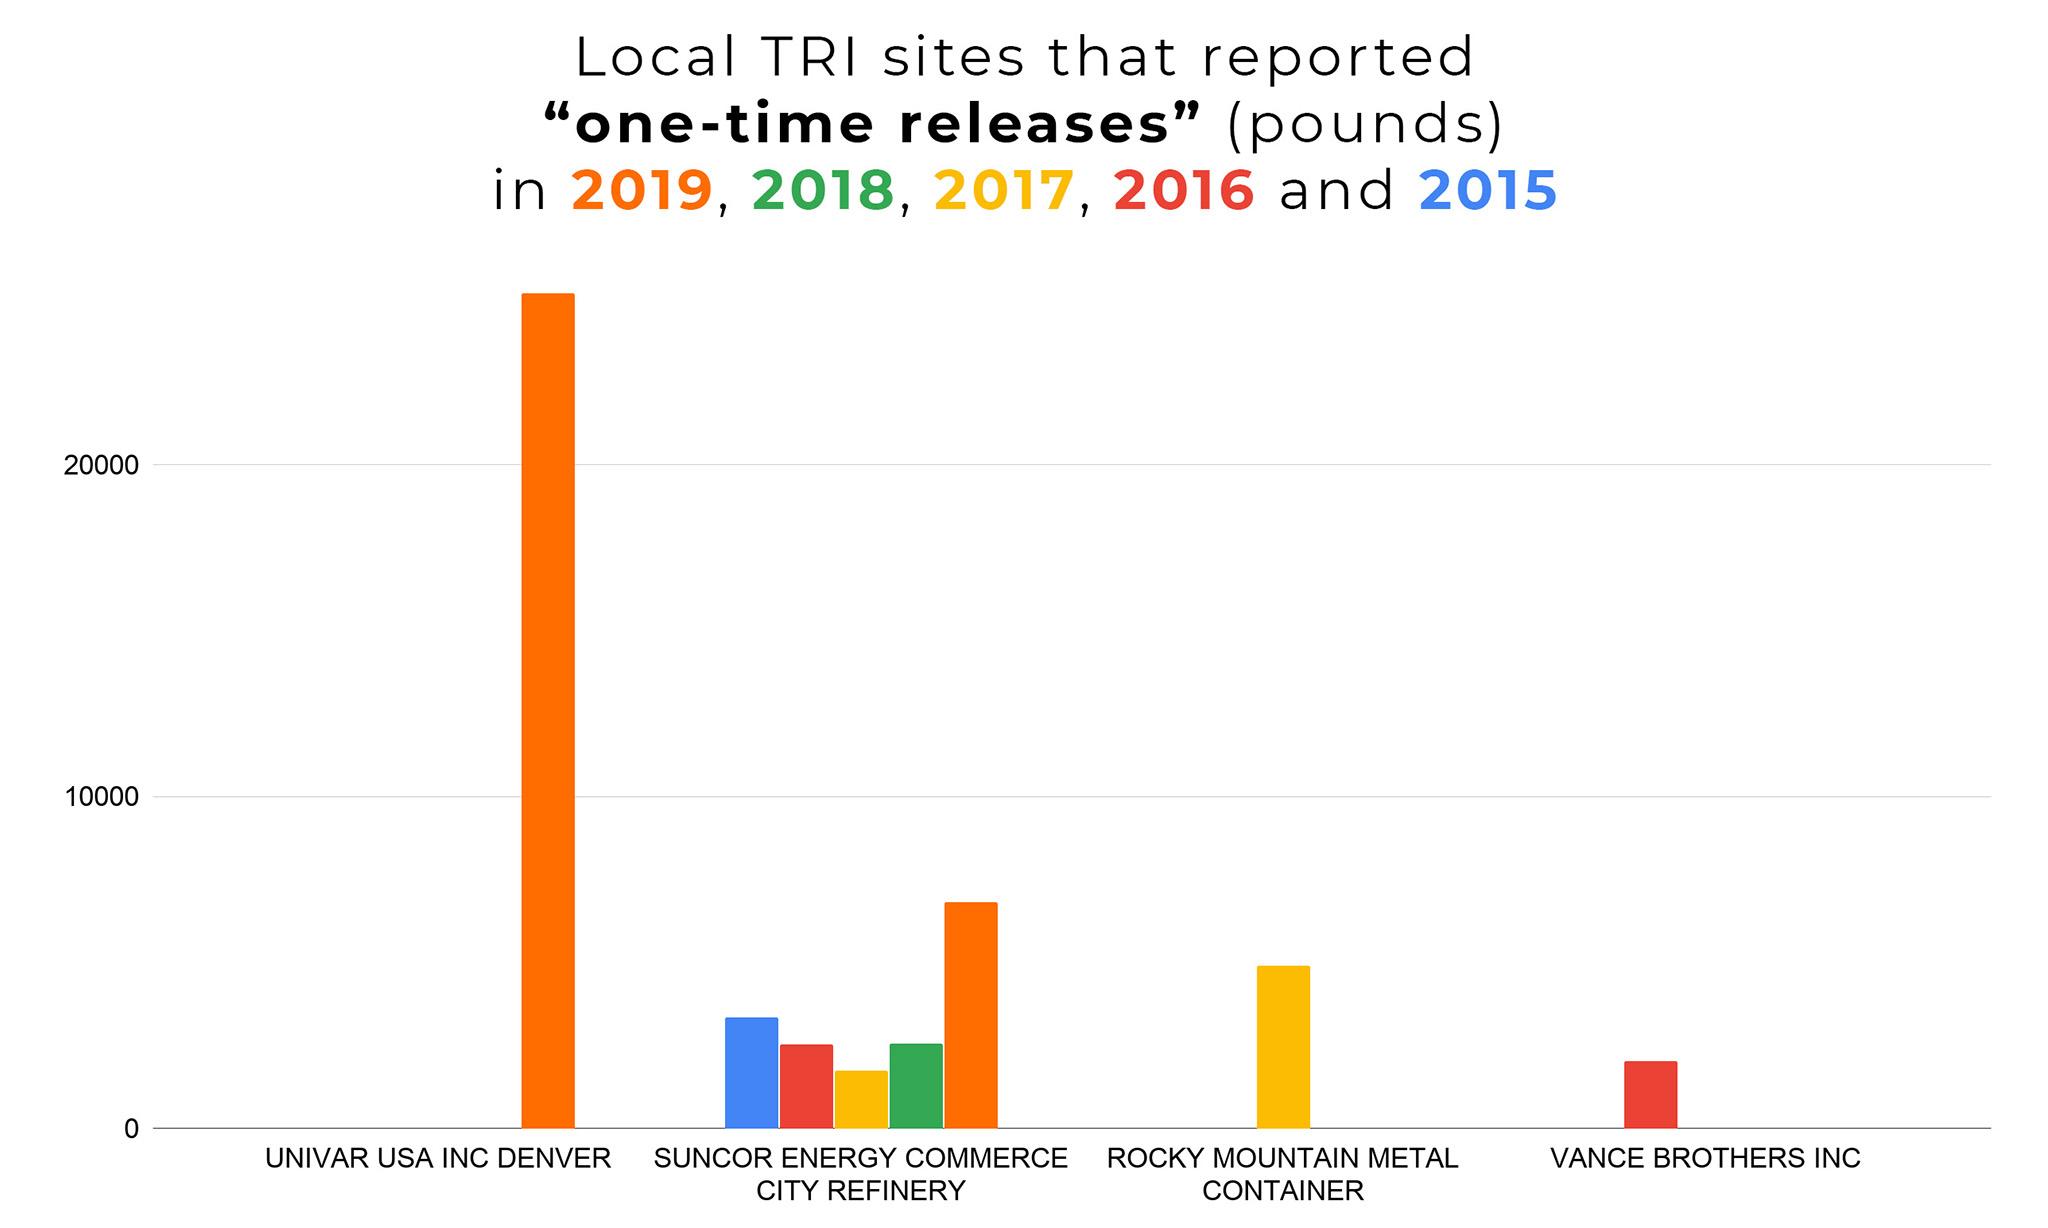
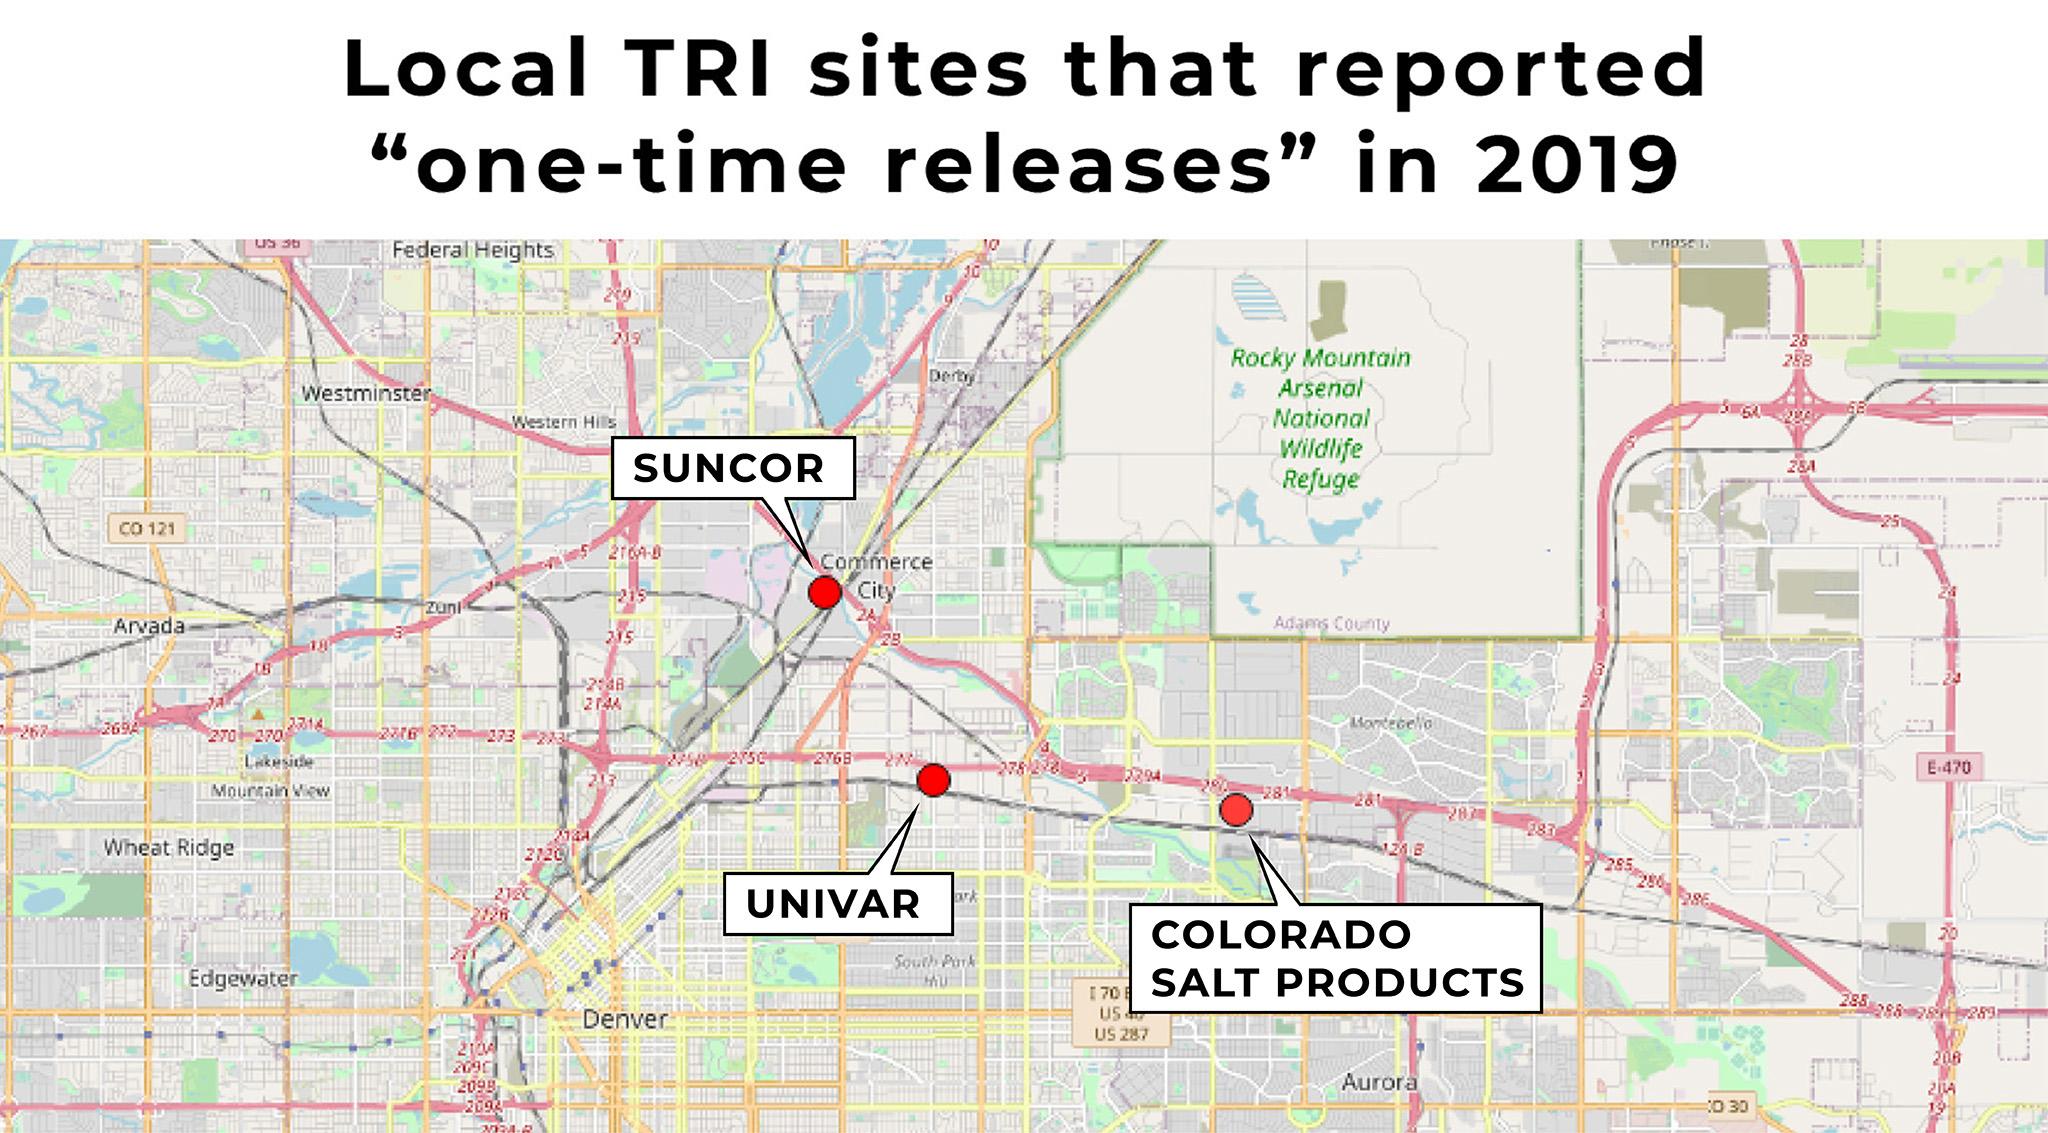
We also looked at the total pounds of chemicals created in "one-time releases" reported by companies in 2019. According to the EPA, these numbers represent waste that is "not associated with routine production processes." One-time releases are essentially the flipside to "production waste," which is expected during the normal course of business. CDPHE's Bare said companies might report waste that's created as the result of emergency shut-offs, like if "catastrophic events such as earthquakes, fires or floods" disrupt industrial processes while they're running.
The Suncor refinery has had some memorable "one-time" events in recent years. In 2016, for instance, a yellow plume of ceramic material rose from its smokestacks after it had to shut down a process midway through its run. Suncor is also the only company in our research area that reported one-time releases every year in the last five years.
Three facilities reported one-time releases in 2019. One of those, Colorado Salt Products LLC, reported 17.6 pounds in 2019, which was such a small amount that we decided to leave it out of our chart.
Let's look at these sites in a national context.
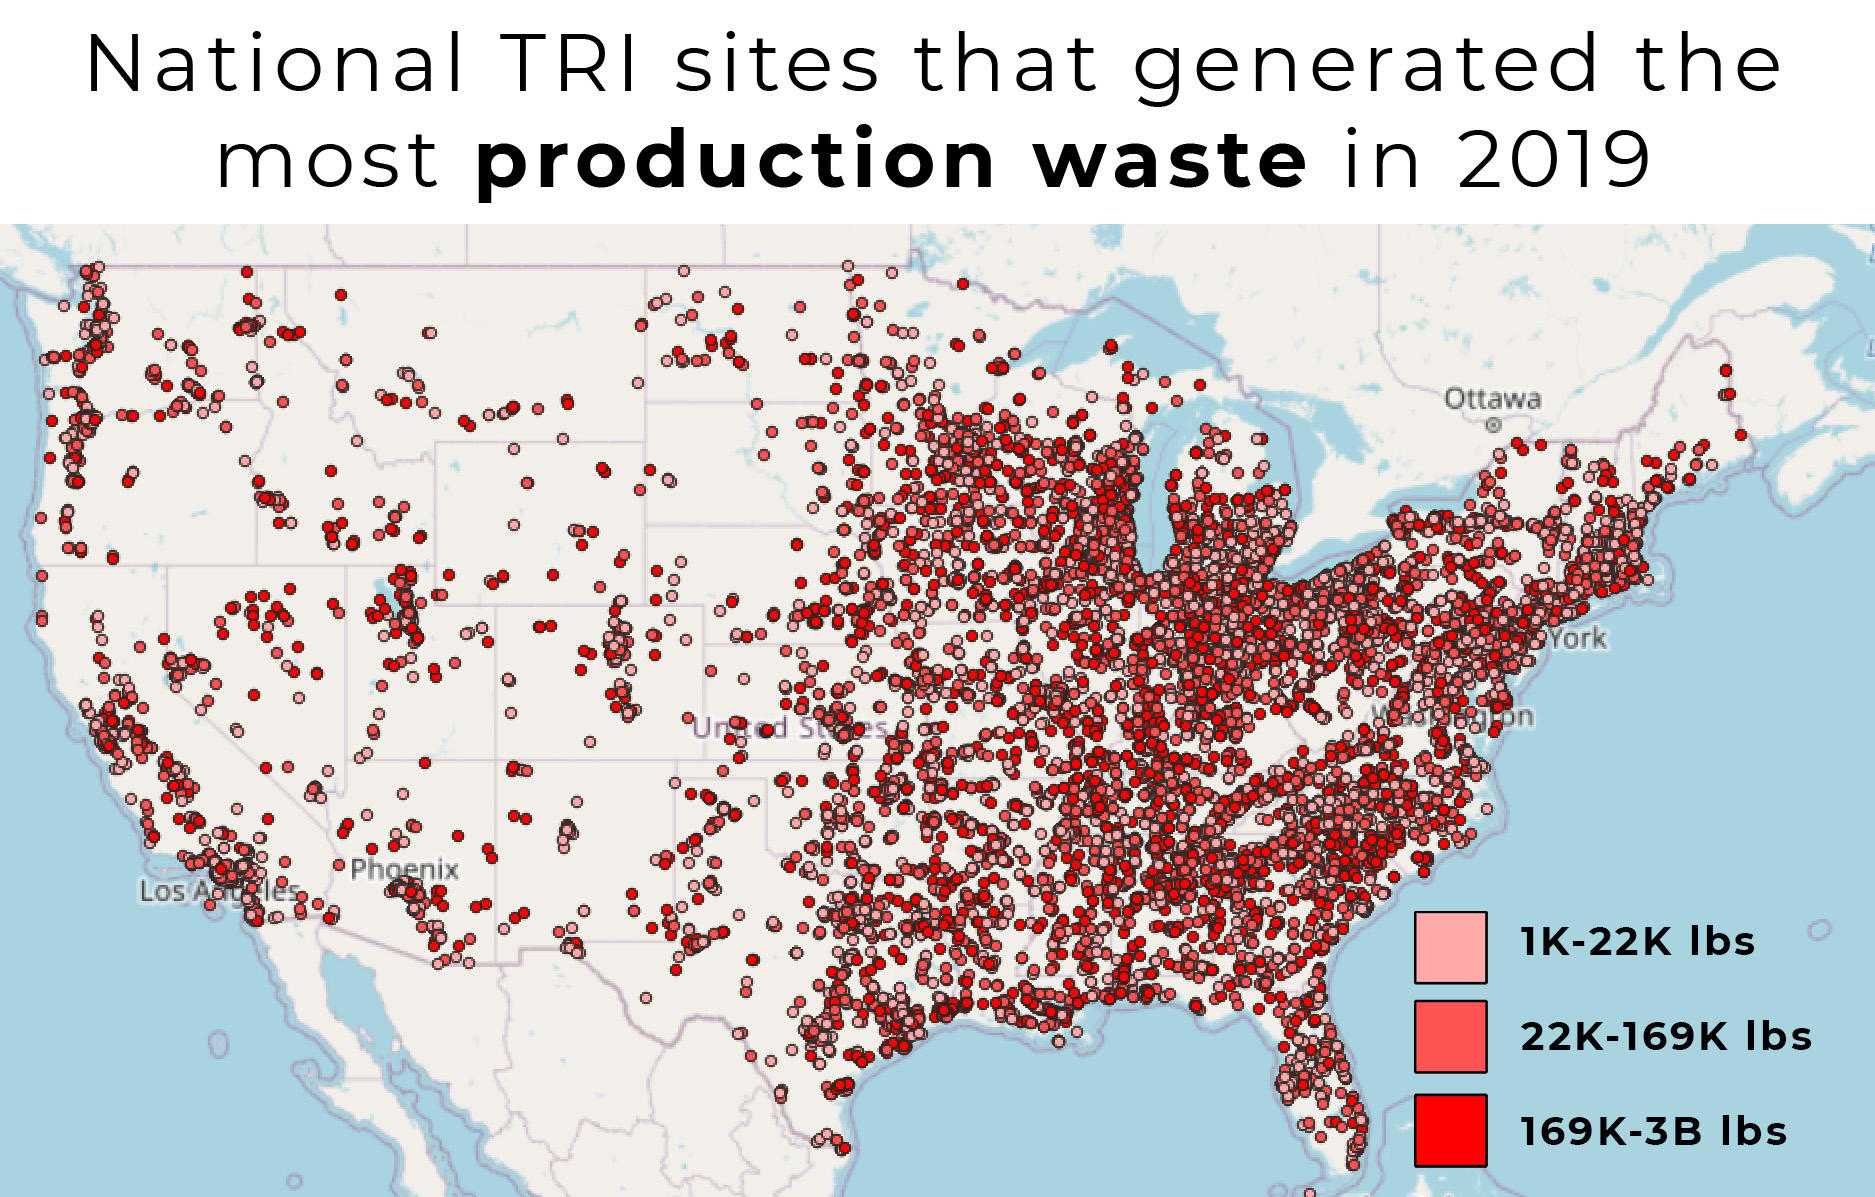
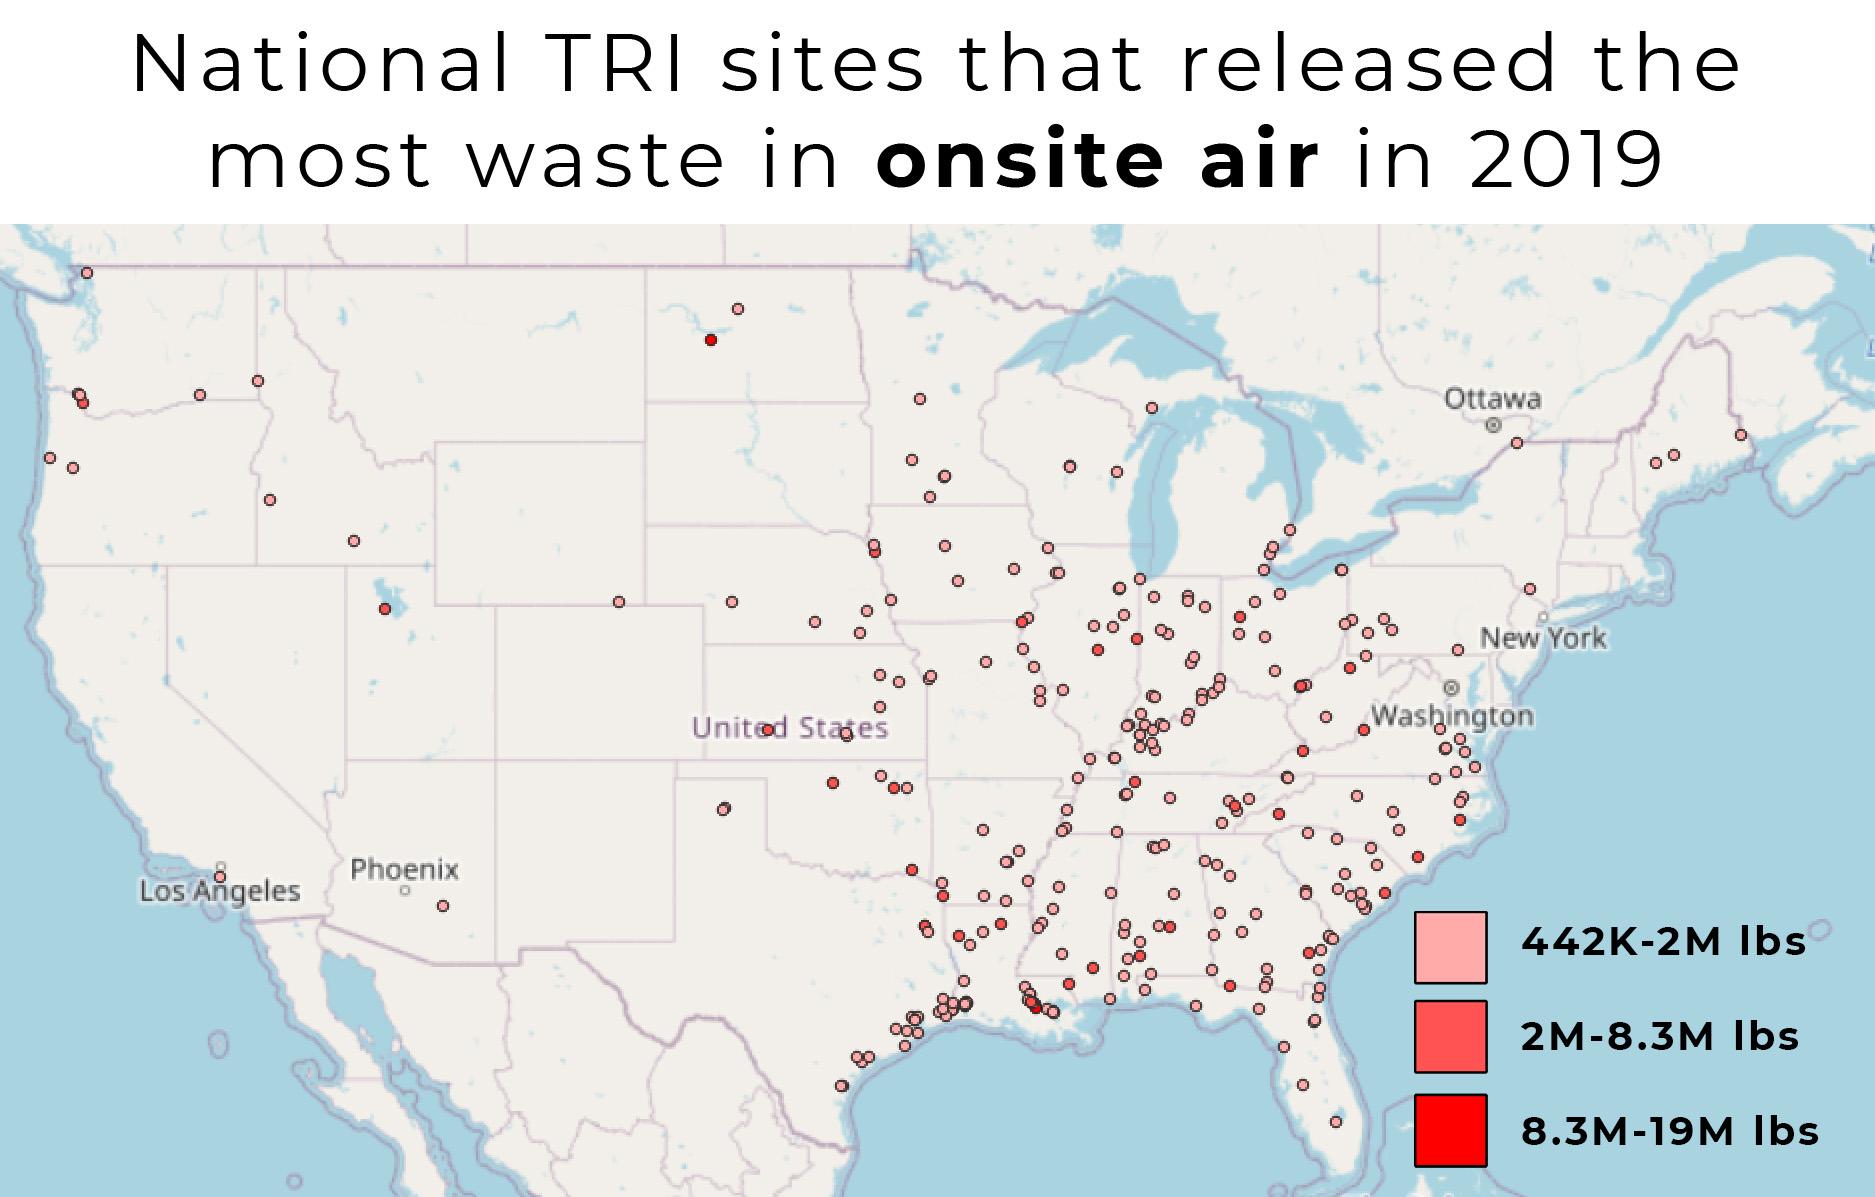
To make these next maps, we added up water, air, one-time releases and production waste to find total weights in each category for each facility. We wanted to run the local results against the entire nation to put them into much more context. When it comes to emissions released into the local atmosphere, for example, we found that no local business held a candle to the biggest polluters elsewhere in the country.
Again, this data doesn't take health risks into account. And to reiterate Bare's earlier point about concentrated chemicals, the facilities that reported lower weights of chemicals released into the air could very well be among the most dangerous.
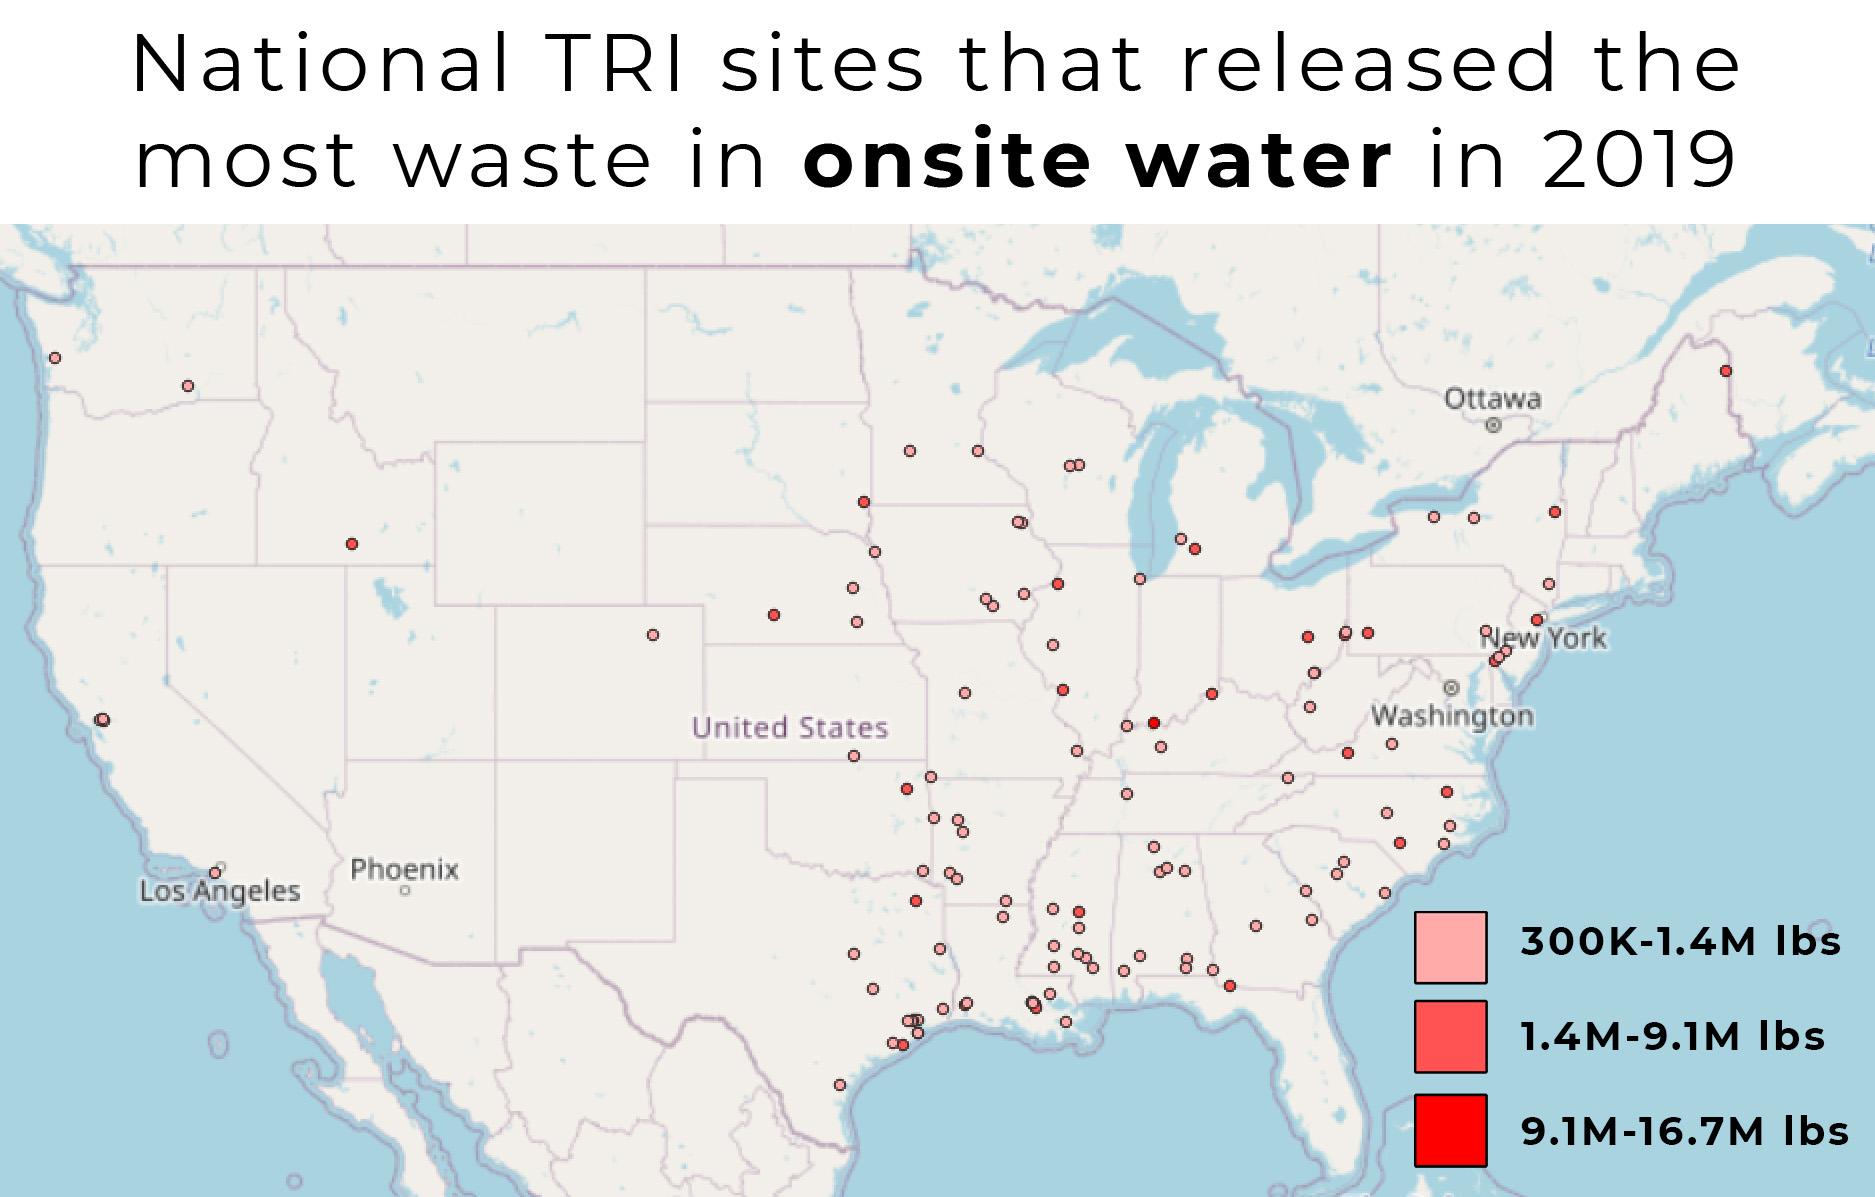
When it comes to water, this nationwide look also excluded all of our local sites. The only site in Colorado that made it onto this map is a Cargill meat plant in Fort Morgan.
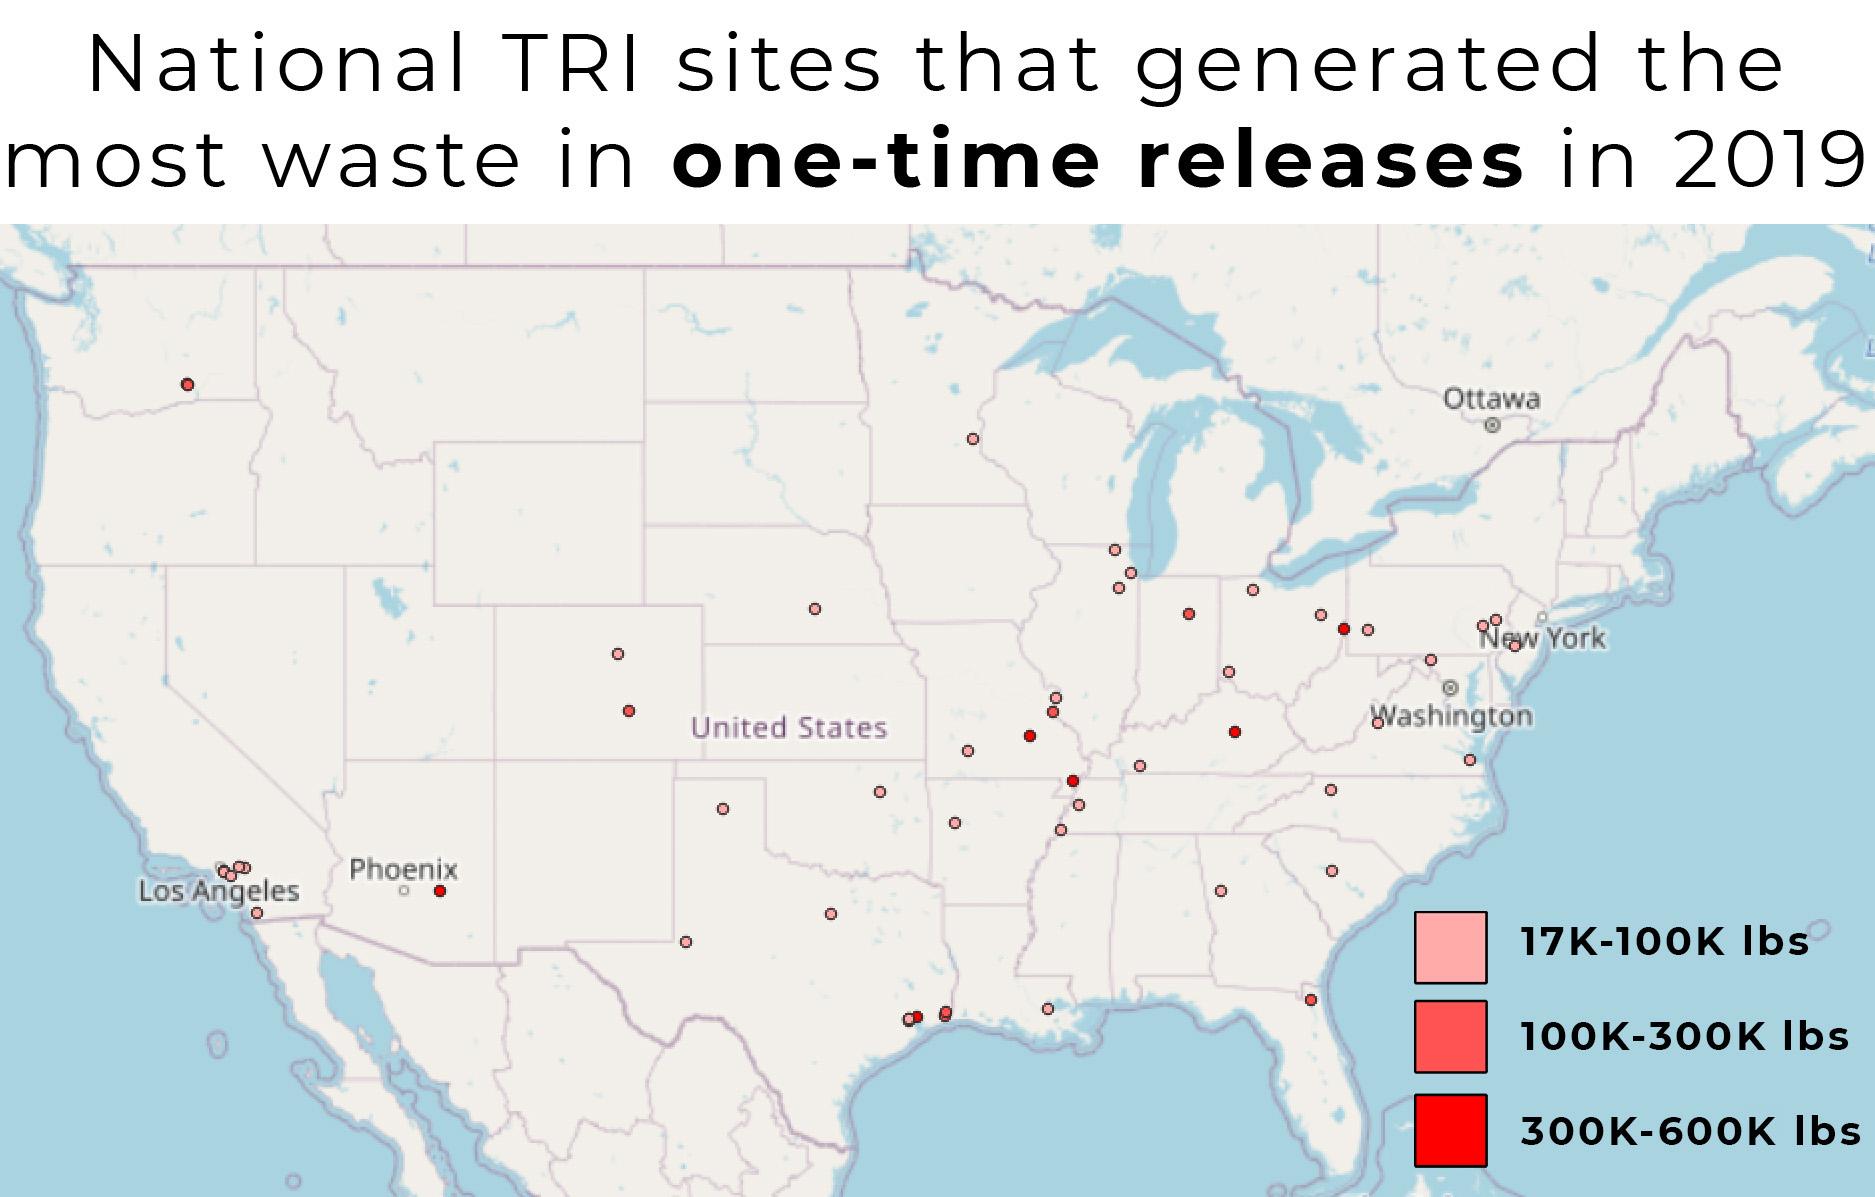
There aren't a lot of sites in the country that represent the highest weights of one-time releases, those that occur outside of normal production processes. But Univar USA, a chemical plant on Holly Street in Northeast Park Hill, made the cut for this map with 25,170 pounds of waste.
Lastly, when it comes to the total pounds of industrial waste created as part of normal operations, many of our local sites are on par with facilities across the nation.