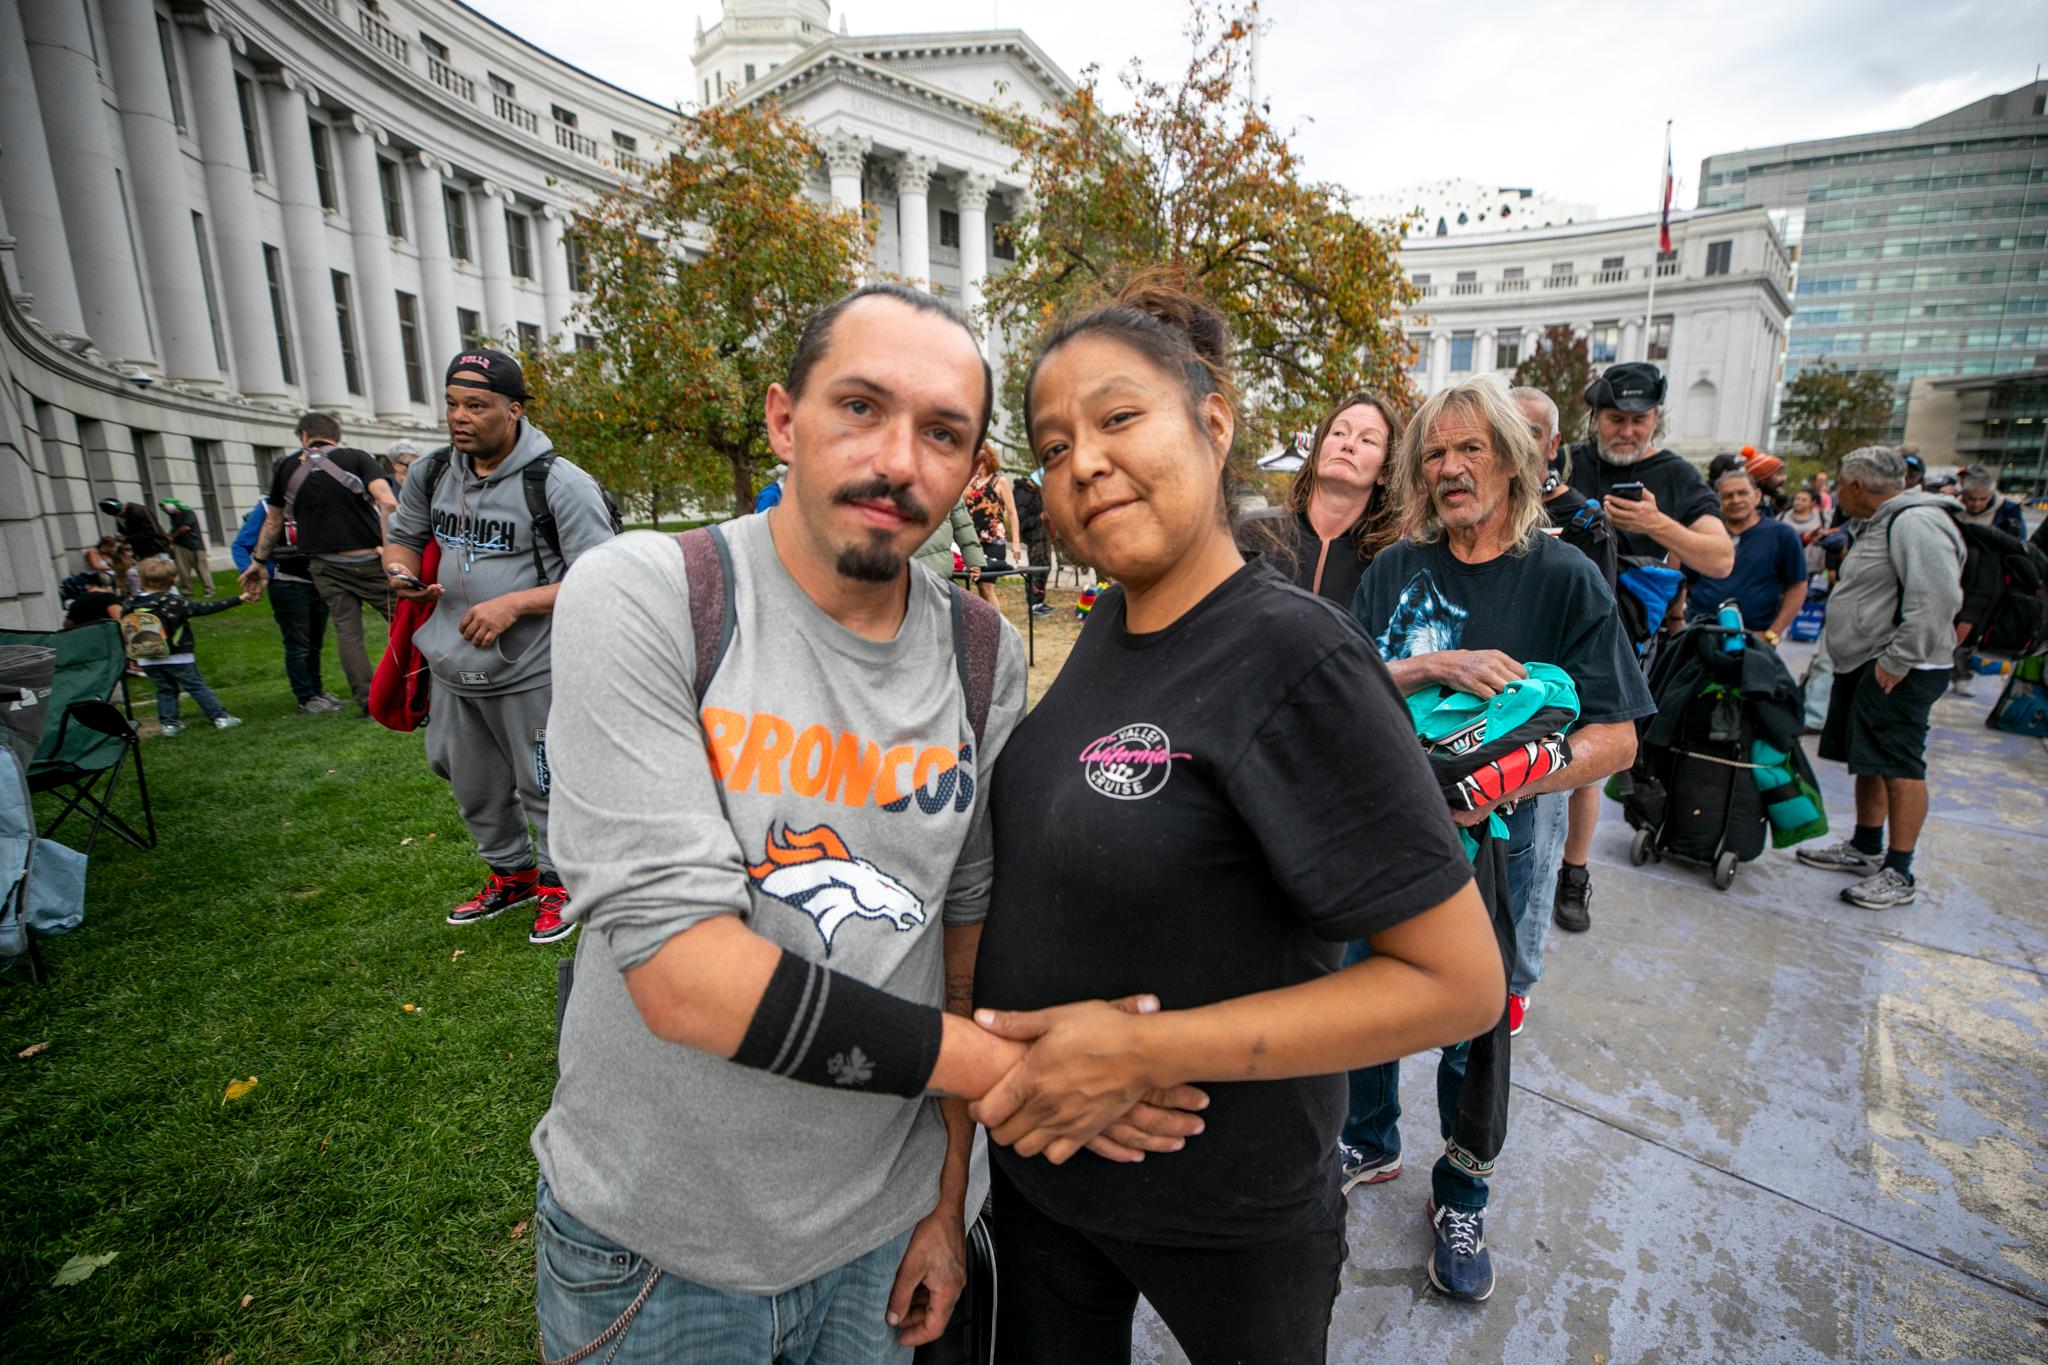
For nearly two years of Mayor Mike Johnston’s first term, a homelessness dashboard painted a complicated picture of how his goal to end unsheltered homelessness was going. Now it’s been replaced.
The new dashboard offers a broader scope but has less specific information, eliminating details about how long people were staying in shelters, and how many of them died or returned to homelessness afterward.
Critics used the data to hold the administration to account. But city officials say the old dashboard was confusing and hard to maintain.
The goal of the new dashboard is to provide clarity and transparency, said Department of Housing Stability (HOST) head Jamie Rife.
The old dashboard had not been updated since December.
What does the new dashboard include?
The original dashboard only covered services provided through All In Mile High, Johnston’s campaign to shutter homeless encampments that once lined the streets of the city center.
The new dashboard covers a much wider scope of city-funded efforts — and, as a result, shows much higher numbers of people getting help.
In all, 6,594 people were moved from the streets into shelters where people have individual rooms and 5,280 people were moved from the streets into housing since Johnston’s first full day in office, July 18, 2023.
By comparison, the old dashboard only counted about 2,200 people as coming indoors, since it was more narrowly focused.
The higher numbers don’t just look better for the Johnston administration. They reflect all of the efforts the city is funding to end unsheltered homelessness, not just those once lumped under All In Mile High, which was previously called House1000.
The city is pivoting toward what it calls a street-to-lease approach. It’s now trying to move people from the outdoors into apartments of their own, often skipping the long-term, individual shelters like motels and tiny homes entirely.
What happened to the rest of the data?
Though city officials are still tracking the number of deaths, people who went to jail, reunited with family and returned to the streets after leaving All In Mile High shelters, that information is no longer available on the dashboard. Curious members of the public have to request it.
Instead, the new dashboard shows how many people had “positive,” “negative” and unknown outcomes.
Currently, 53 percent had positive outcomes (getting into housing), 33 percent had negative outcomes (death, jail, a return to the streets) and 14 percent had uncertain fates.
Johnston has said if the outcomes are unknown, he assumes they are negative.
The new dashboard also shows the data over time, starting on Johnston’s first full day in office, when he declared a homelessness state of emergency.
Eventually, the dashboard will include data from the city’s Roads to Recovery program, an effort to connect people experiencing homelessness and addiction indoors. And it also includes data from the annual Point-In-Time Count, which tracks the number of people experiencing unsheltered homelessness on one winter night each year.
The dashboard will be updated on the first Wednesday of each month.