The L: It's the twelfth letter of the alphabet, a shorthand for Chicago's transit system, and sign language used by bullies for a couple of weeks in 1995.
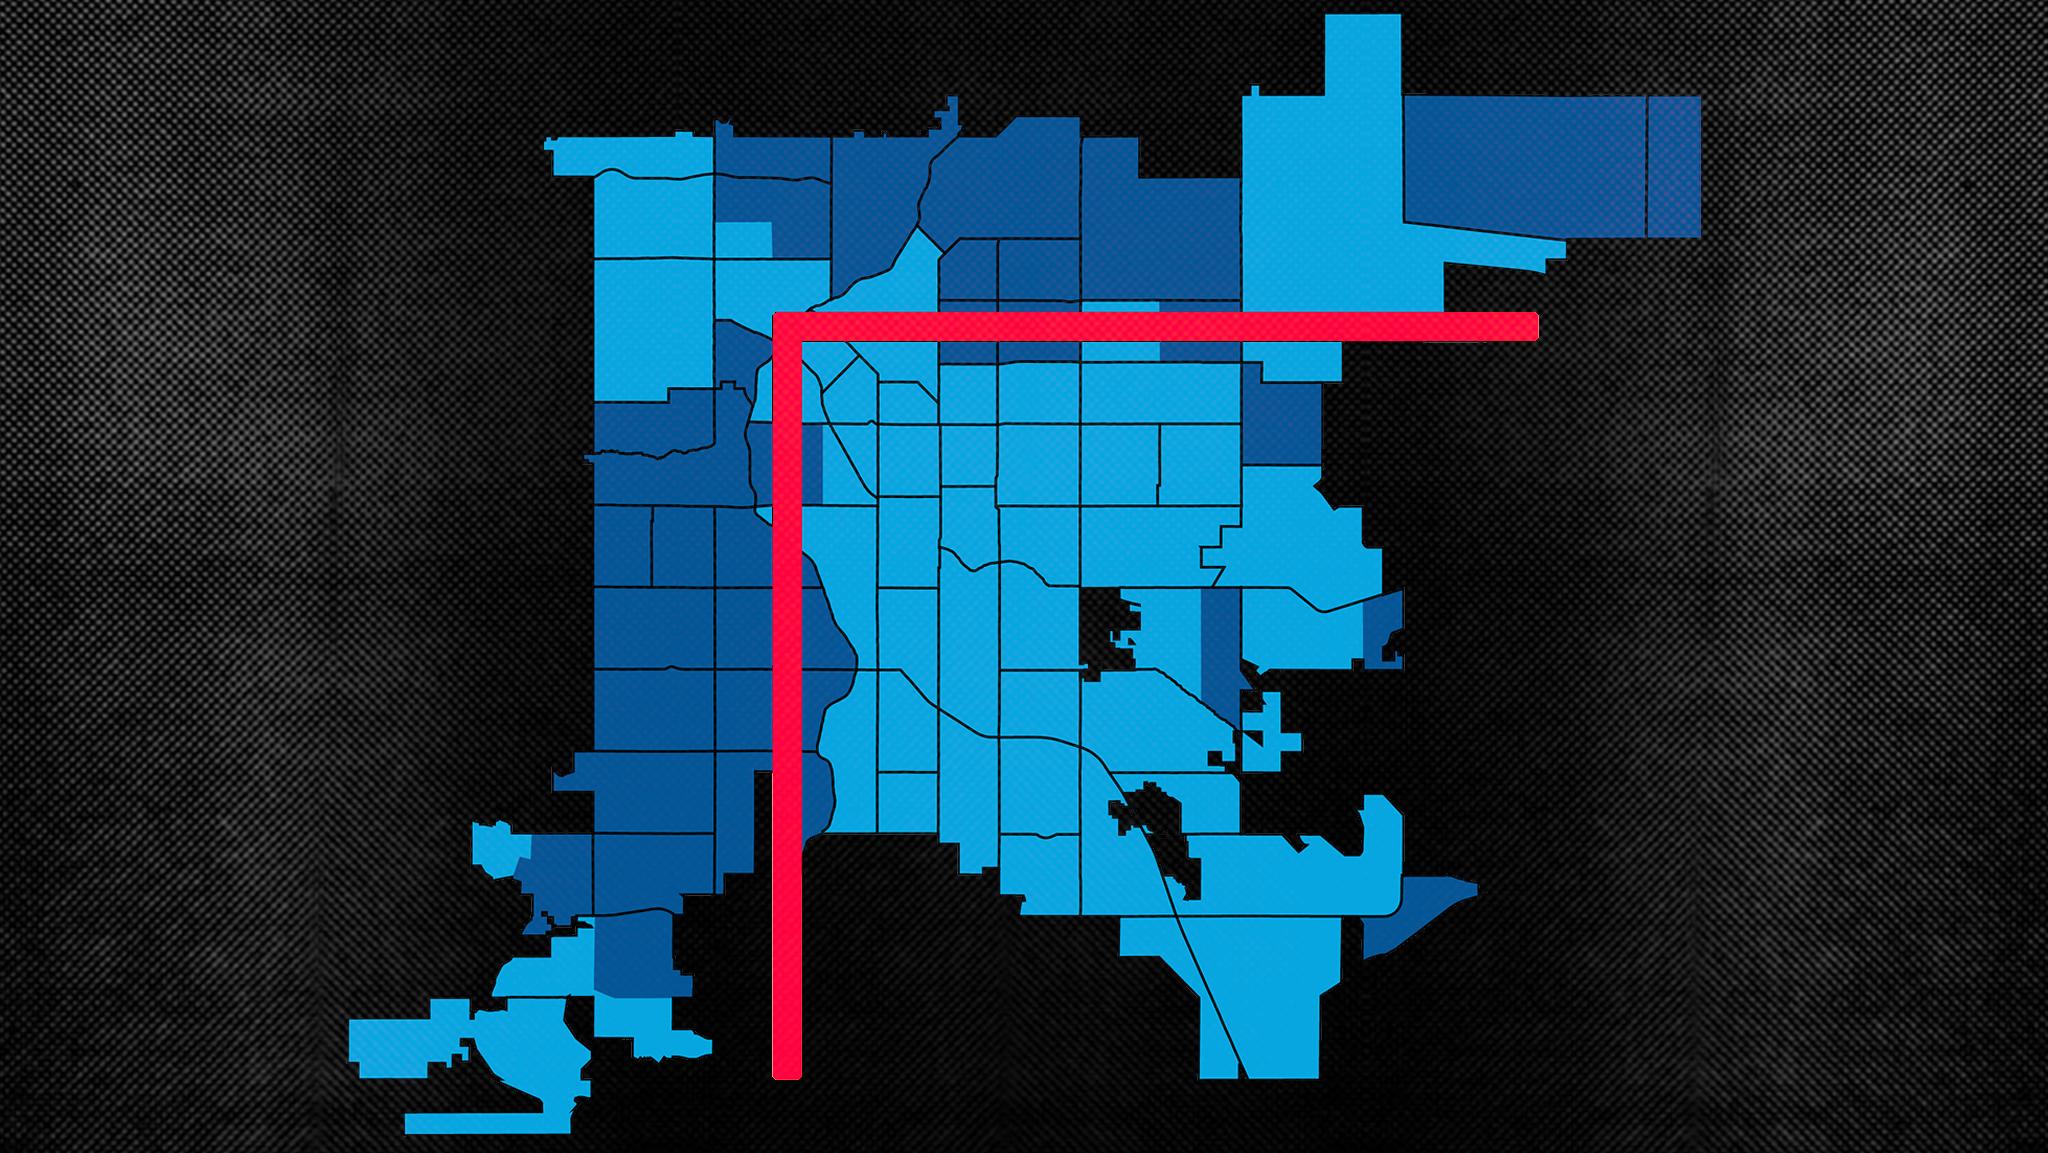
Turns out it's also a tool that helps us understand a lot about geographic disparities in Denver. If you invert the letter L and place it over a map of Denver, it forms a boundary more or less aligned with I-70 and I-25. People on opposite sides of the inverted L share things, sure, but the shape also illustrates stark physical and socioeconomic barriers in the city.
First, a disclaimer: This is not an exercise in rigid cartography. The inverted L represents a sketch of how things are. We've got experts to poke at why those realities exist.
Wealthier people live farther from the dog food smell today because of how Denver was founded.
Early Denverites (and the Native Americans before them) used rivers and creeks to move people and things. So they naturally set up shop along the South Platte River, Cherry Creek and Sand Creek. Industry settled on those banks next -- complete with air and water pollution -- along the transportation pipeline. Trains followed, which gave us the "wrong side of the tracks" idiom. Then, in the 1960s, highways.
These areas, flanked by smelters back in the day and the Purina pet food plant today, gradually became less desirable places to live because of pollution and noise. If people could afford it, they moved farther away and upwind, according to Steven Chester, a senior city planner with Denver Community Planning and Development.
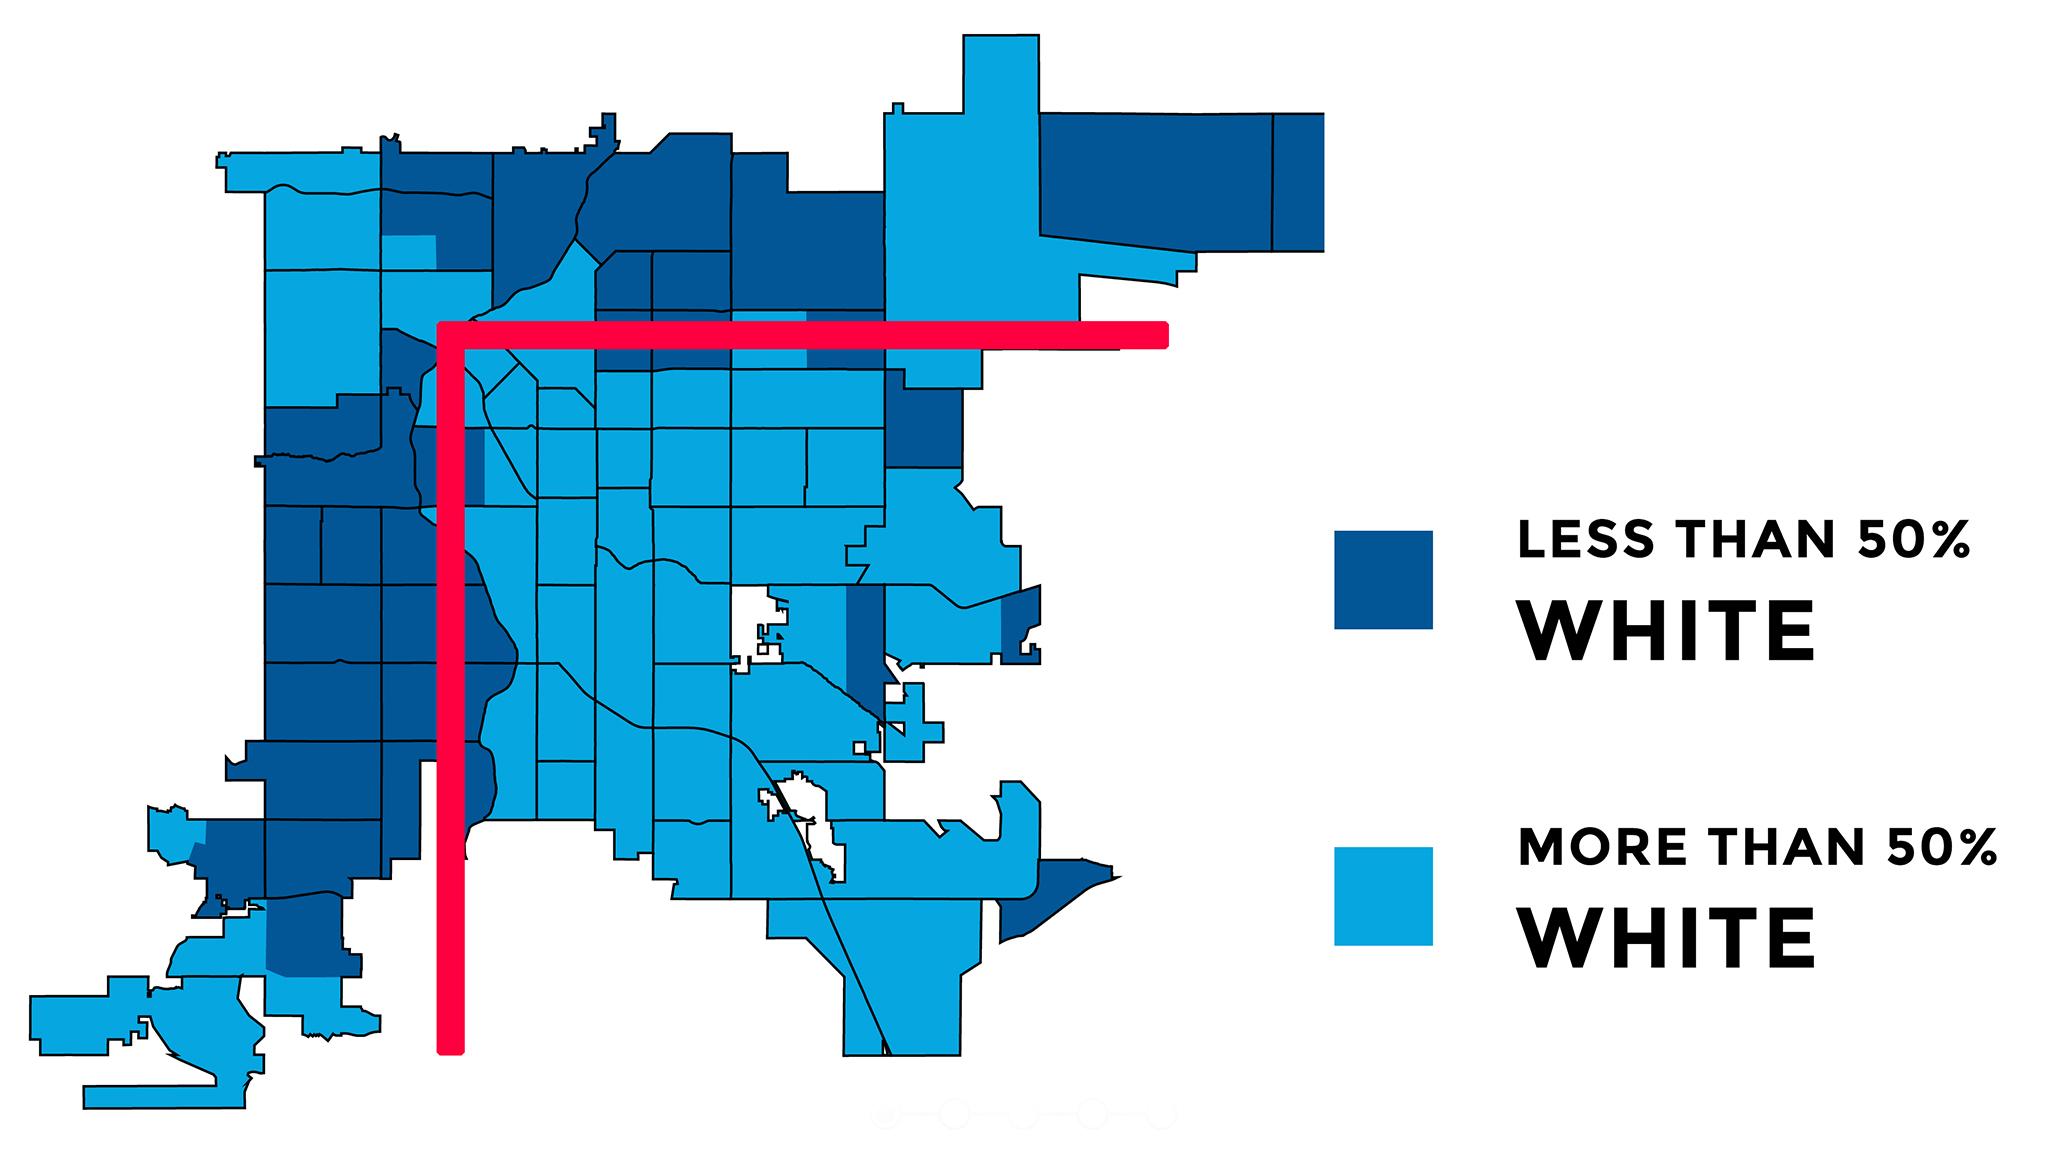
Today, people with less money tend to live north and west of the inverted L. People of color tend to be concentrated there as well, like in Elyria-Swansea, a predominately Latino, low-income neighborhood that's shrinking because of a wider I-70 in its backyard.
Meanwhile, those who live further away from the L are more likely to be white, according to this map adapted from the city's Blueprint Denver draft.
"It sort of became a self-fulfilling prophecy, where originally people moved away to get away from the ills of industrial life, but then maybe retailers relocated. So there's more shops and commercial activity, money and a demand for infrastructure," Chester said. "And it just sort of reinforced itself to create these sections of inequity throughout the city."
The inverted L is something city planners talk about, Chester said, even if they don't use that exact term. The "favored quarter," coined by author and researcher Christopher Leinberger, describes the wealthier parts of town shaped by the market and government investment. Redlining, or the official segregation of housing and development based on race, exacerbated that gap and continues to today in a major way.
The city was about 52 percent non-Hispanic white in 2000, according to the U.S. Census Bureau. It is now about 54 percent non-Hispanic white.
"Denver is a diverse city but at the same time a segregated city when you look at the dispersal of ethnic and racial backgrounds," Chester said. "Cities, including Denver, are working really hard to reverse 100 years of inequitable distribution of investments."
Residents all over Denver are leery of losing their ability to stay put as the market threatens to outstrip their wealth, particularly on the "wrong side" of the L.
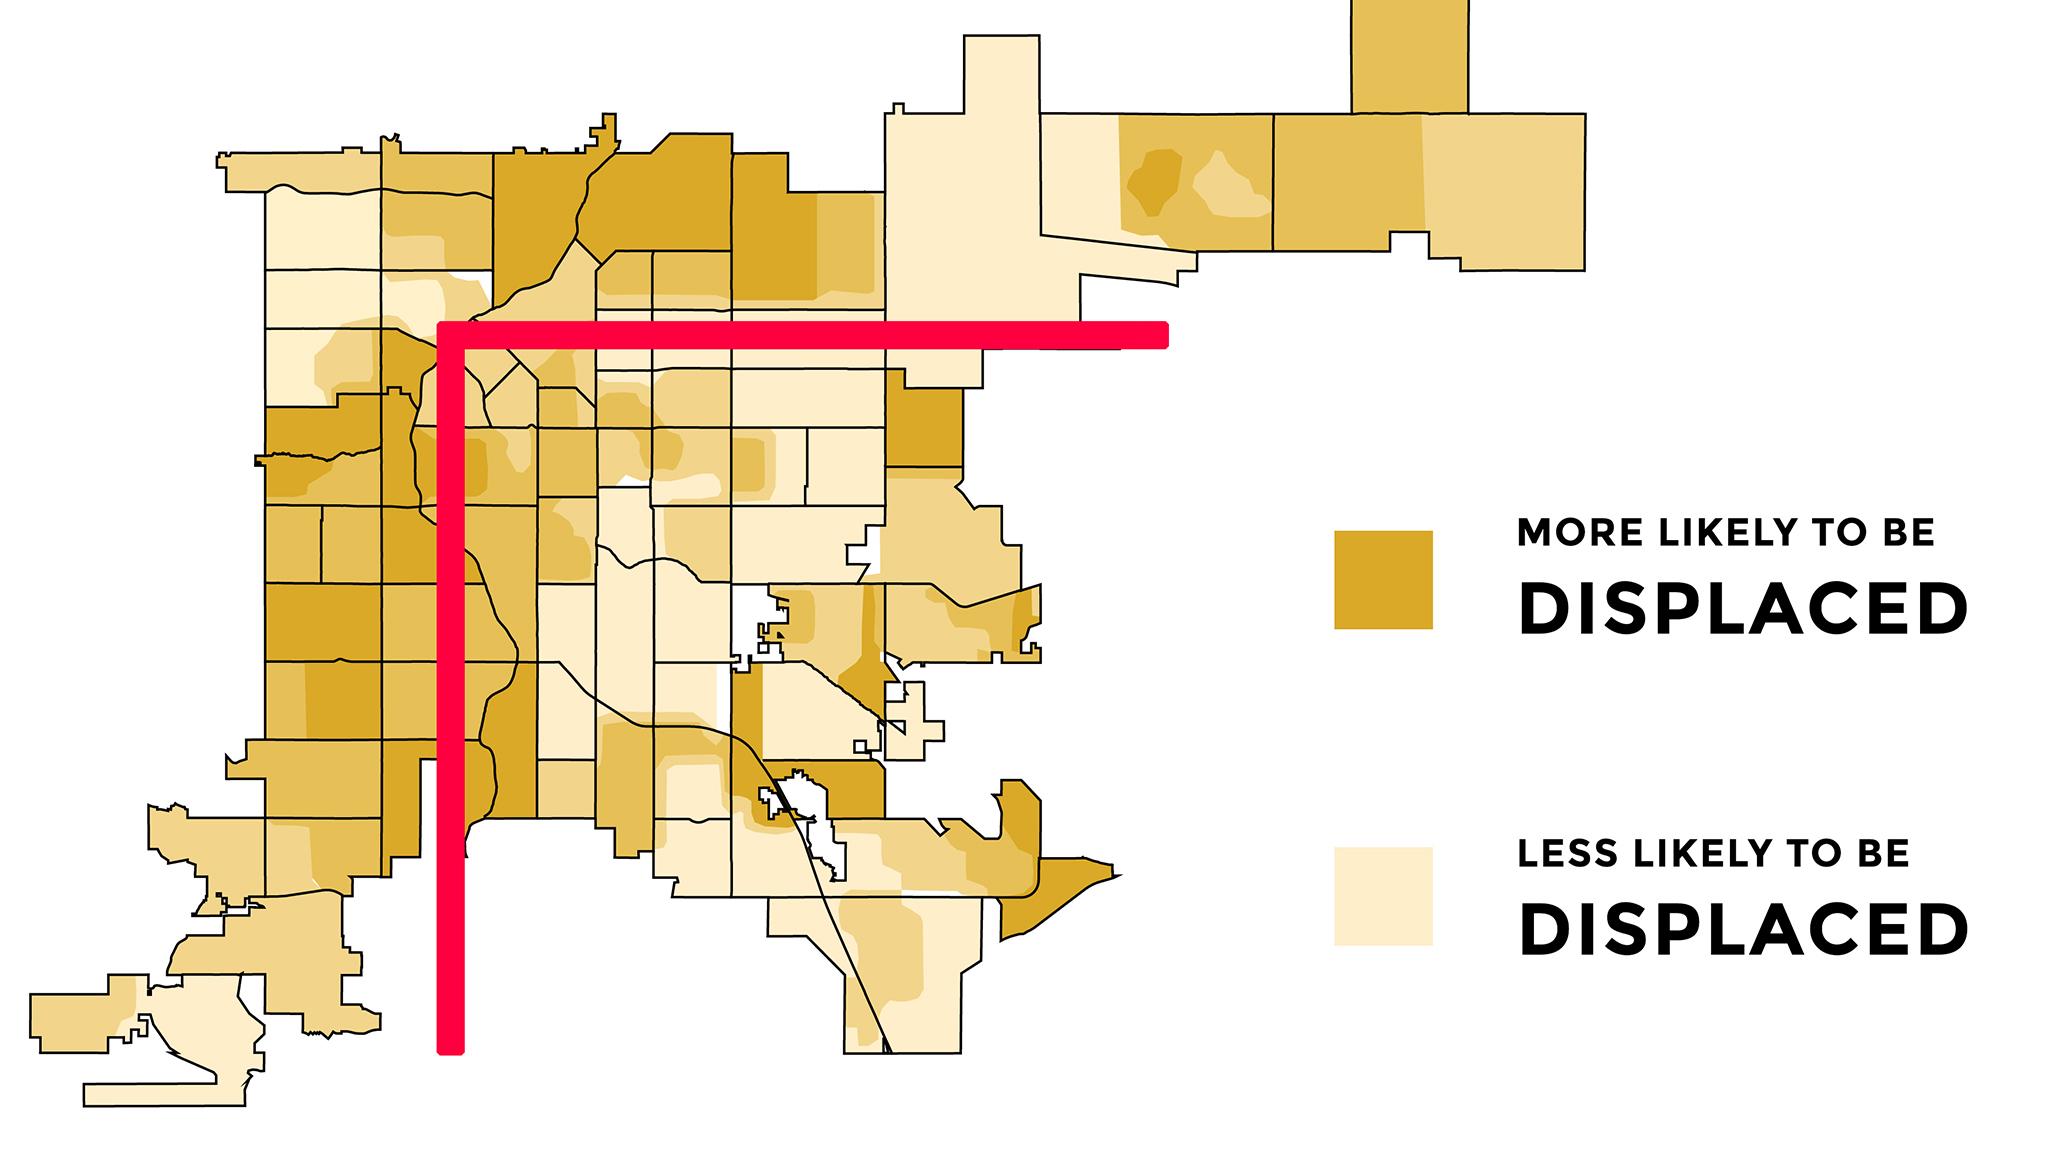
Sudden investment after years of neglect shocks neighborhoods into an unaffordable state for some residents. And guess what? Many of the most vulnerable Denverites are north and west of the L, according to this map adapted from the city's Blueprint Denver draft, whether it's because rent is too damn high, or because homeowners' property tax bills are catapulting higher every year.
"Overall home valuations were lapped onto all property owners, which really started to put some pressure on those (west side) communities," said Jennifer Newcomer, the principal researcher at Denver's Shift Research Lab. "The community there has gotten to a point where they're not interested in a lot of outside investment because they've seen the detriment and the aftermath of their former neighboring communities."
Newcomer is very familiar with the inverted L because she researches socioeconomic patterns and their relationship to geography for a living.
"Indicators relating to education attainment, income, poverty status and employment," she said. "No matter what you pull in the way of those indicators they all predominantly follow the same pattern."
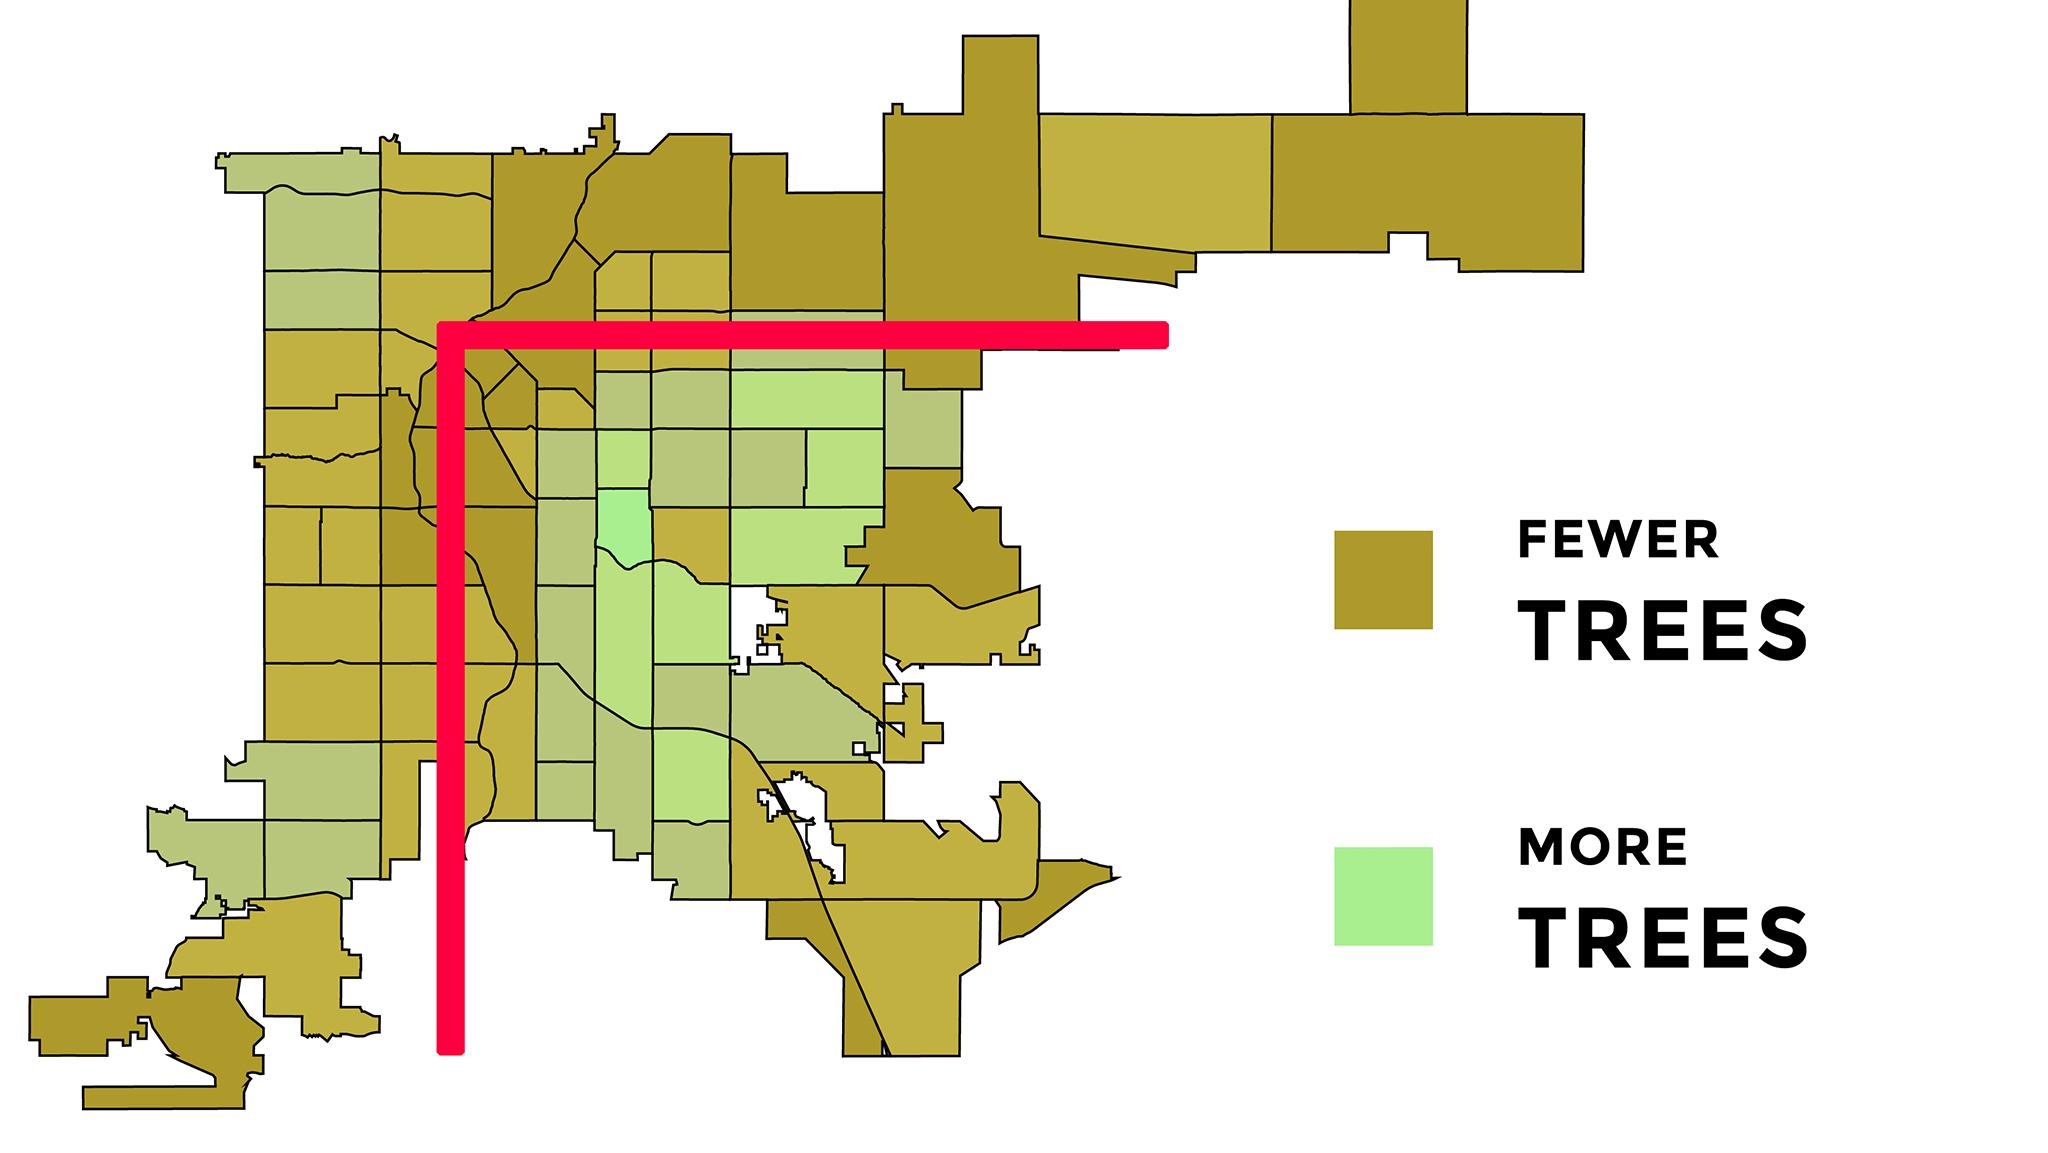
There's even more tree shade on one side of the L.
The thing about trees in Denver is, they don't exactly belong everywhere. Not organically at least. We live in a dry prairie, and if you don't believe me, look at the sea of grass out by the airport, where humans don't really live.
According to urban forestry manager Sara Davis, most of Denver's trees exist solely because humans wanted them -- both today and in the 1870s, when settlers brought acorns here. Some of those trees still exist.
"Those are kind of like the pioneer trees, who came along with the people," Davis said.
She stopped me from explaining the concept of the inverted L -- she'd seen it in many times in her work.
Urban and industrial areas near the freeways have the least extensive tree canopy, according to this map adapted from the city's Denveright planning process.
Denver's urban incarnation makes trees harder to plant. Tall buildings block the sun while the hardscape limits places to plant. That's why the L seeps into downtown in this map.
The canopy disparity exists for other reasons, too. One is sidewalks. You may have heard that 40 percent of streets have subpar or missing sidewalks. They're also concentrated in low-income areas. Many don't have tree lawns (that patch of green between the sidewalk and the street), so there are fewer places in the public right-of-way for the city to put trees, said Rob Davis, Denver's forester.
"There seems to be a visual indication that you should put a tree right there," Rob Davis said. "In other neighborhoods where the sidewalks are attached to the curb there's no visual cue. My gut feeling is that streetscape design has a lot to with it."
The city partners with groups to plant trees on private and public property for cheap through its Denver Digs Trees program. Even then, lower income Denverites have to spend money watering the saplings, which is another reason for the L-shaped disparity, Rob Davis said.
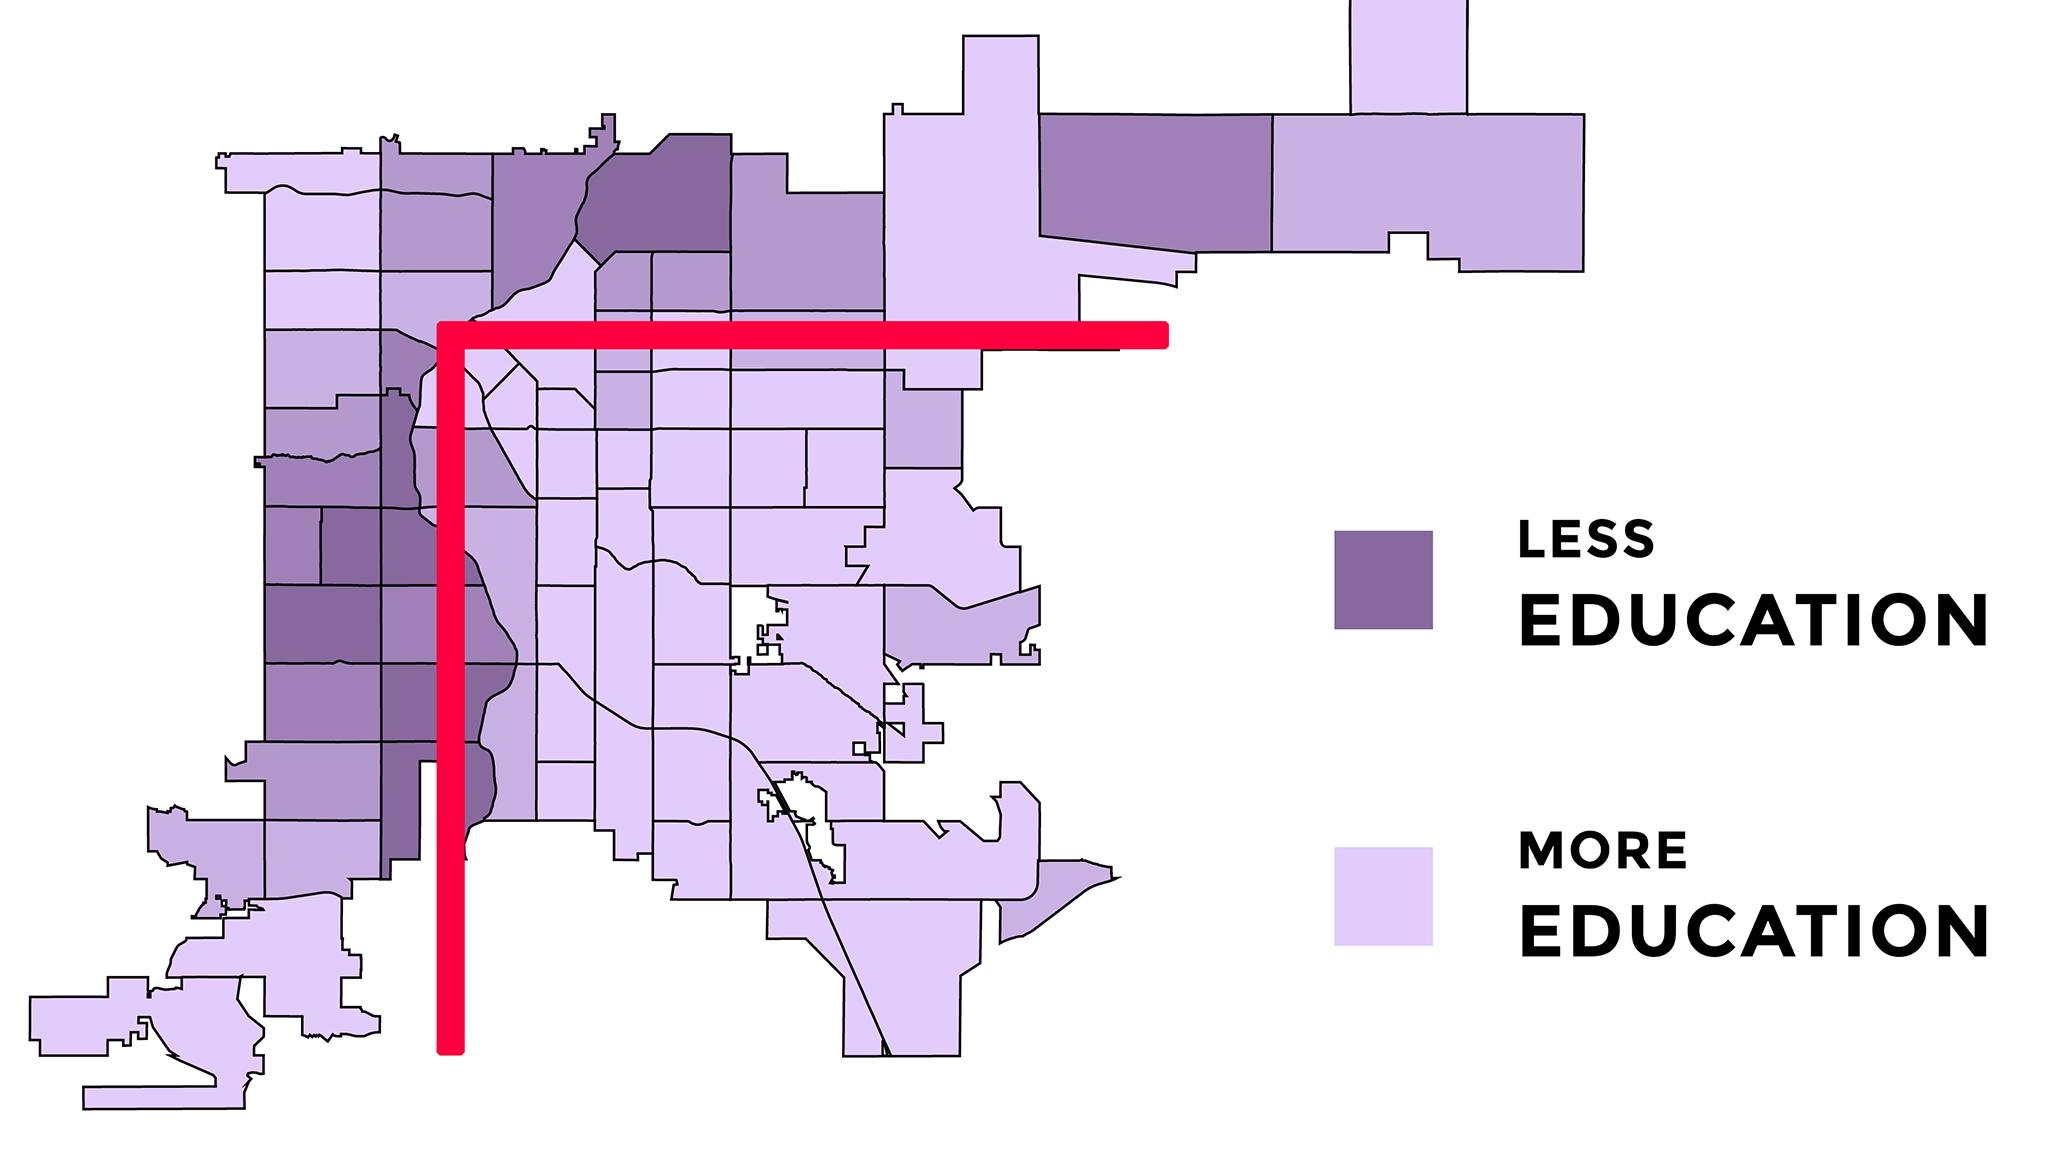
85 percent of Overland residents have a high school education. Next door in Ruby Hill -- but across the L -- only 57 percent do.
That stark disparity comes from a 2018 map created by Denver Technology Services with U.S. Census data. The trend repeats on almost every part of the L: north and west neighborhoods thoroughly underperform, when compared to their counterparts from across the L, nearly every time.
"We are very familiar with the L because you see that same configuration show up in a lot of different ways," said Jake Cousins, communications director for Padres & Jóvenes Unidos, a group that works with parents and students to advocate for educational equity. "If you look at the individual schools there and talk to the kids and the families, the prevailing story is that these schools are underfunded by the district."
Cousins takes issue with schools on the "wrong side" of the L over-policing students with onsite officers. He'd rather see them spending money on mental health professionals, he said. It's not the only reason for the disparity, "prison-like conditions," as he called them, don't provide an environment with a trajectory of graduation, he said, pointing to research on discipline reform.


