Editor's note: If you're reading this in 2021, just know all these numbers come from 2019 or earlier.
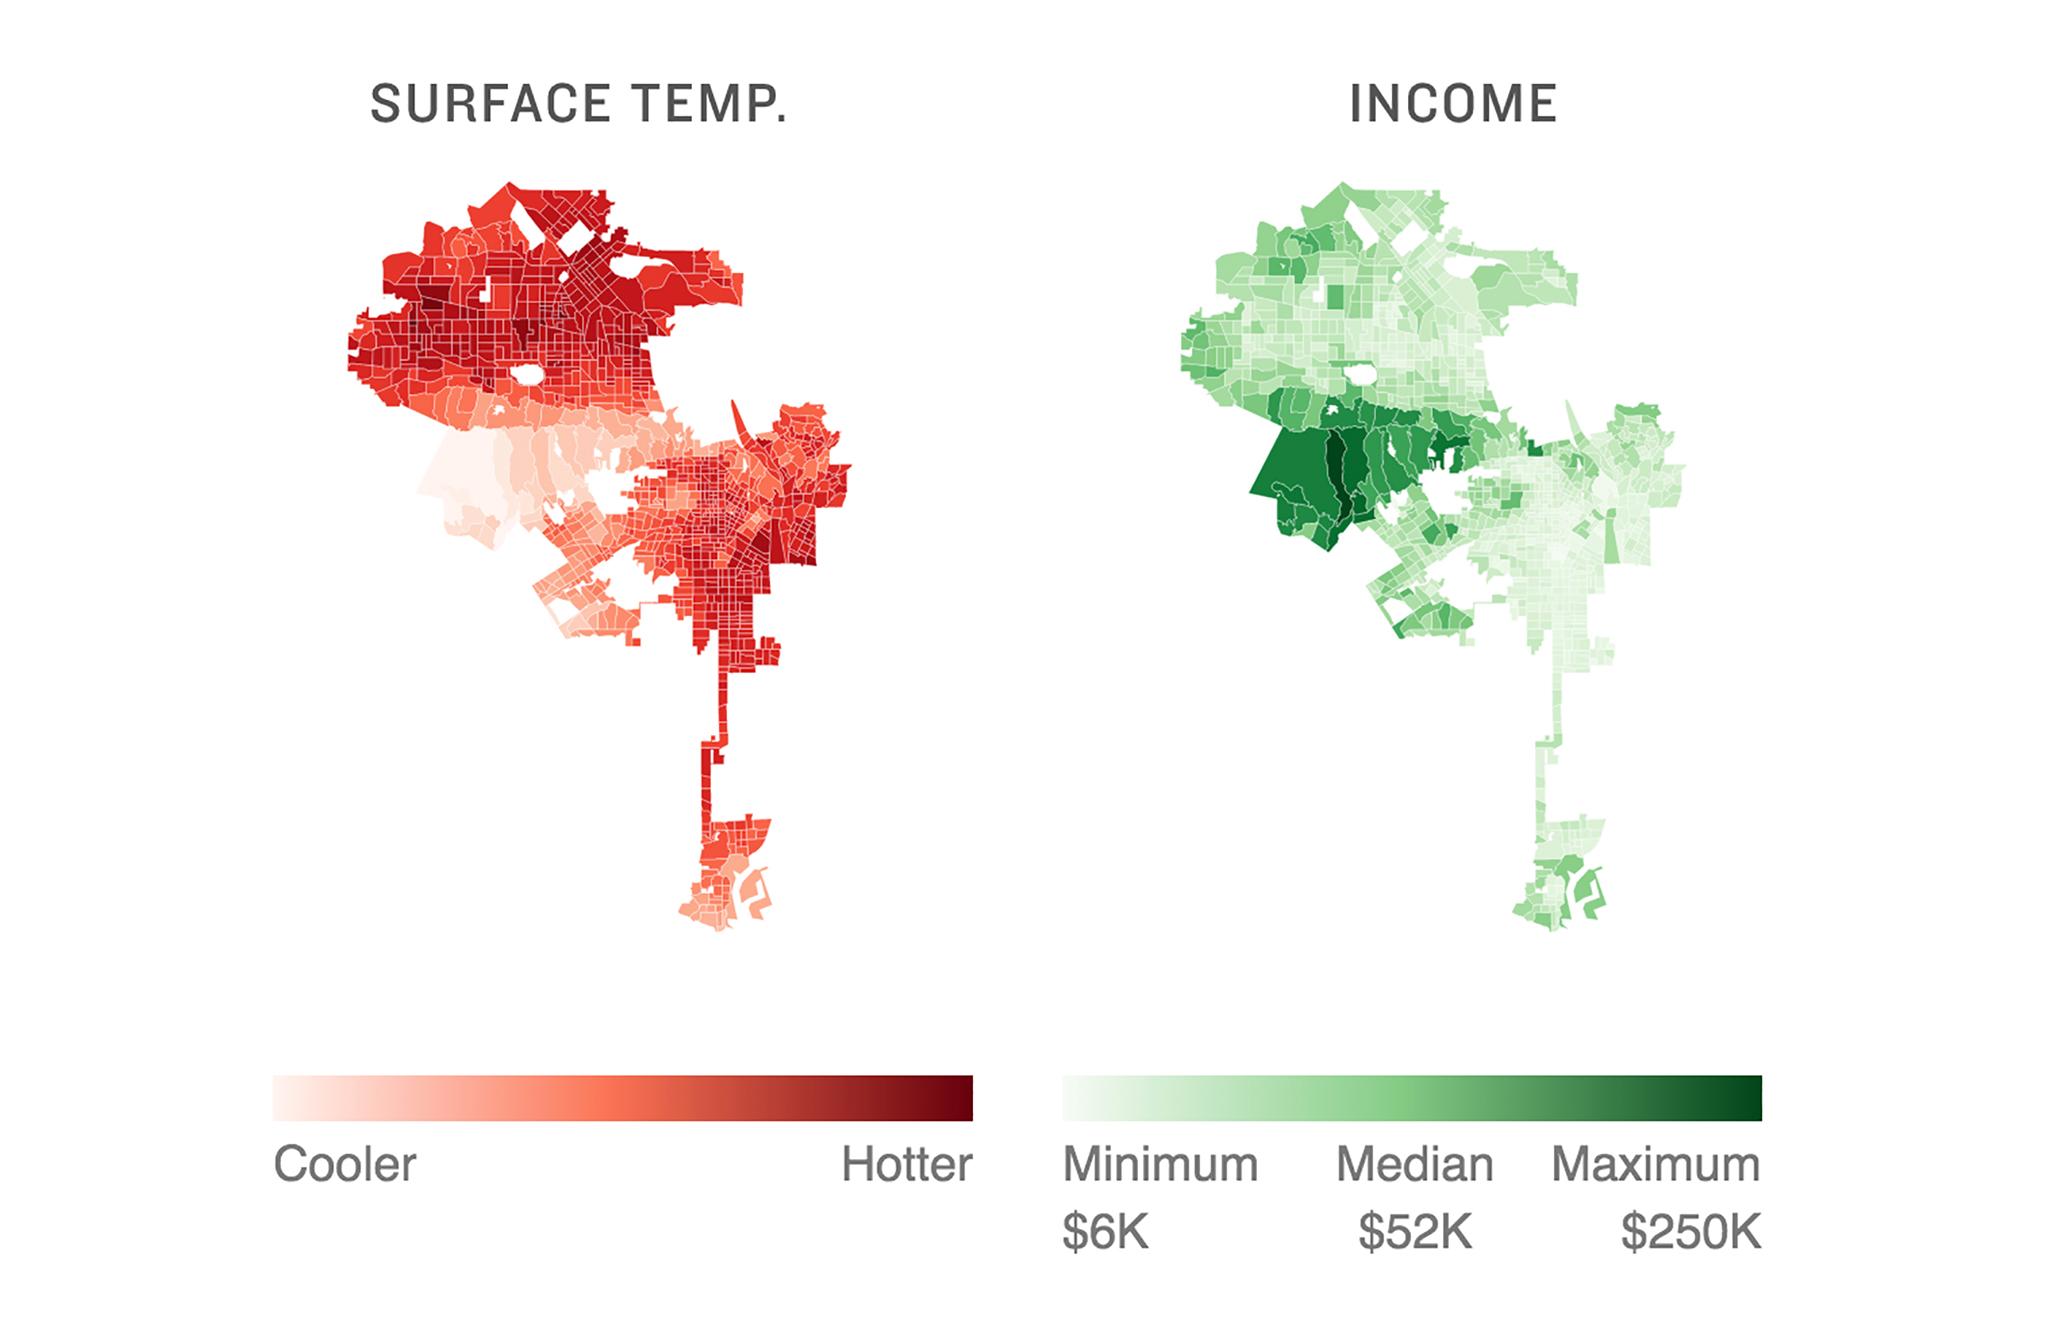
Last week, NPR released an investigation that revealed hotter areas in cities often correlate with lower incomes.
"Those exposed to that extra heat are often a city's most vulnerable: the poorest and, our data show, disproportionately people of color," authors Meg Anderson and Sean McMinn wrote.
Their story was punctuated by the reality that people who experience extreme temperatures are also more likely to suffer poor health outcomes as a result of where they live. That disparity exists today, they wrote, but it will worsen as Earth's climate continues to warm.
For cities with the highest correlations between income (provided by census data) and surface temperatures (measured on a single day via satellite), the maps they created gave striking credence to their thesis.
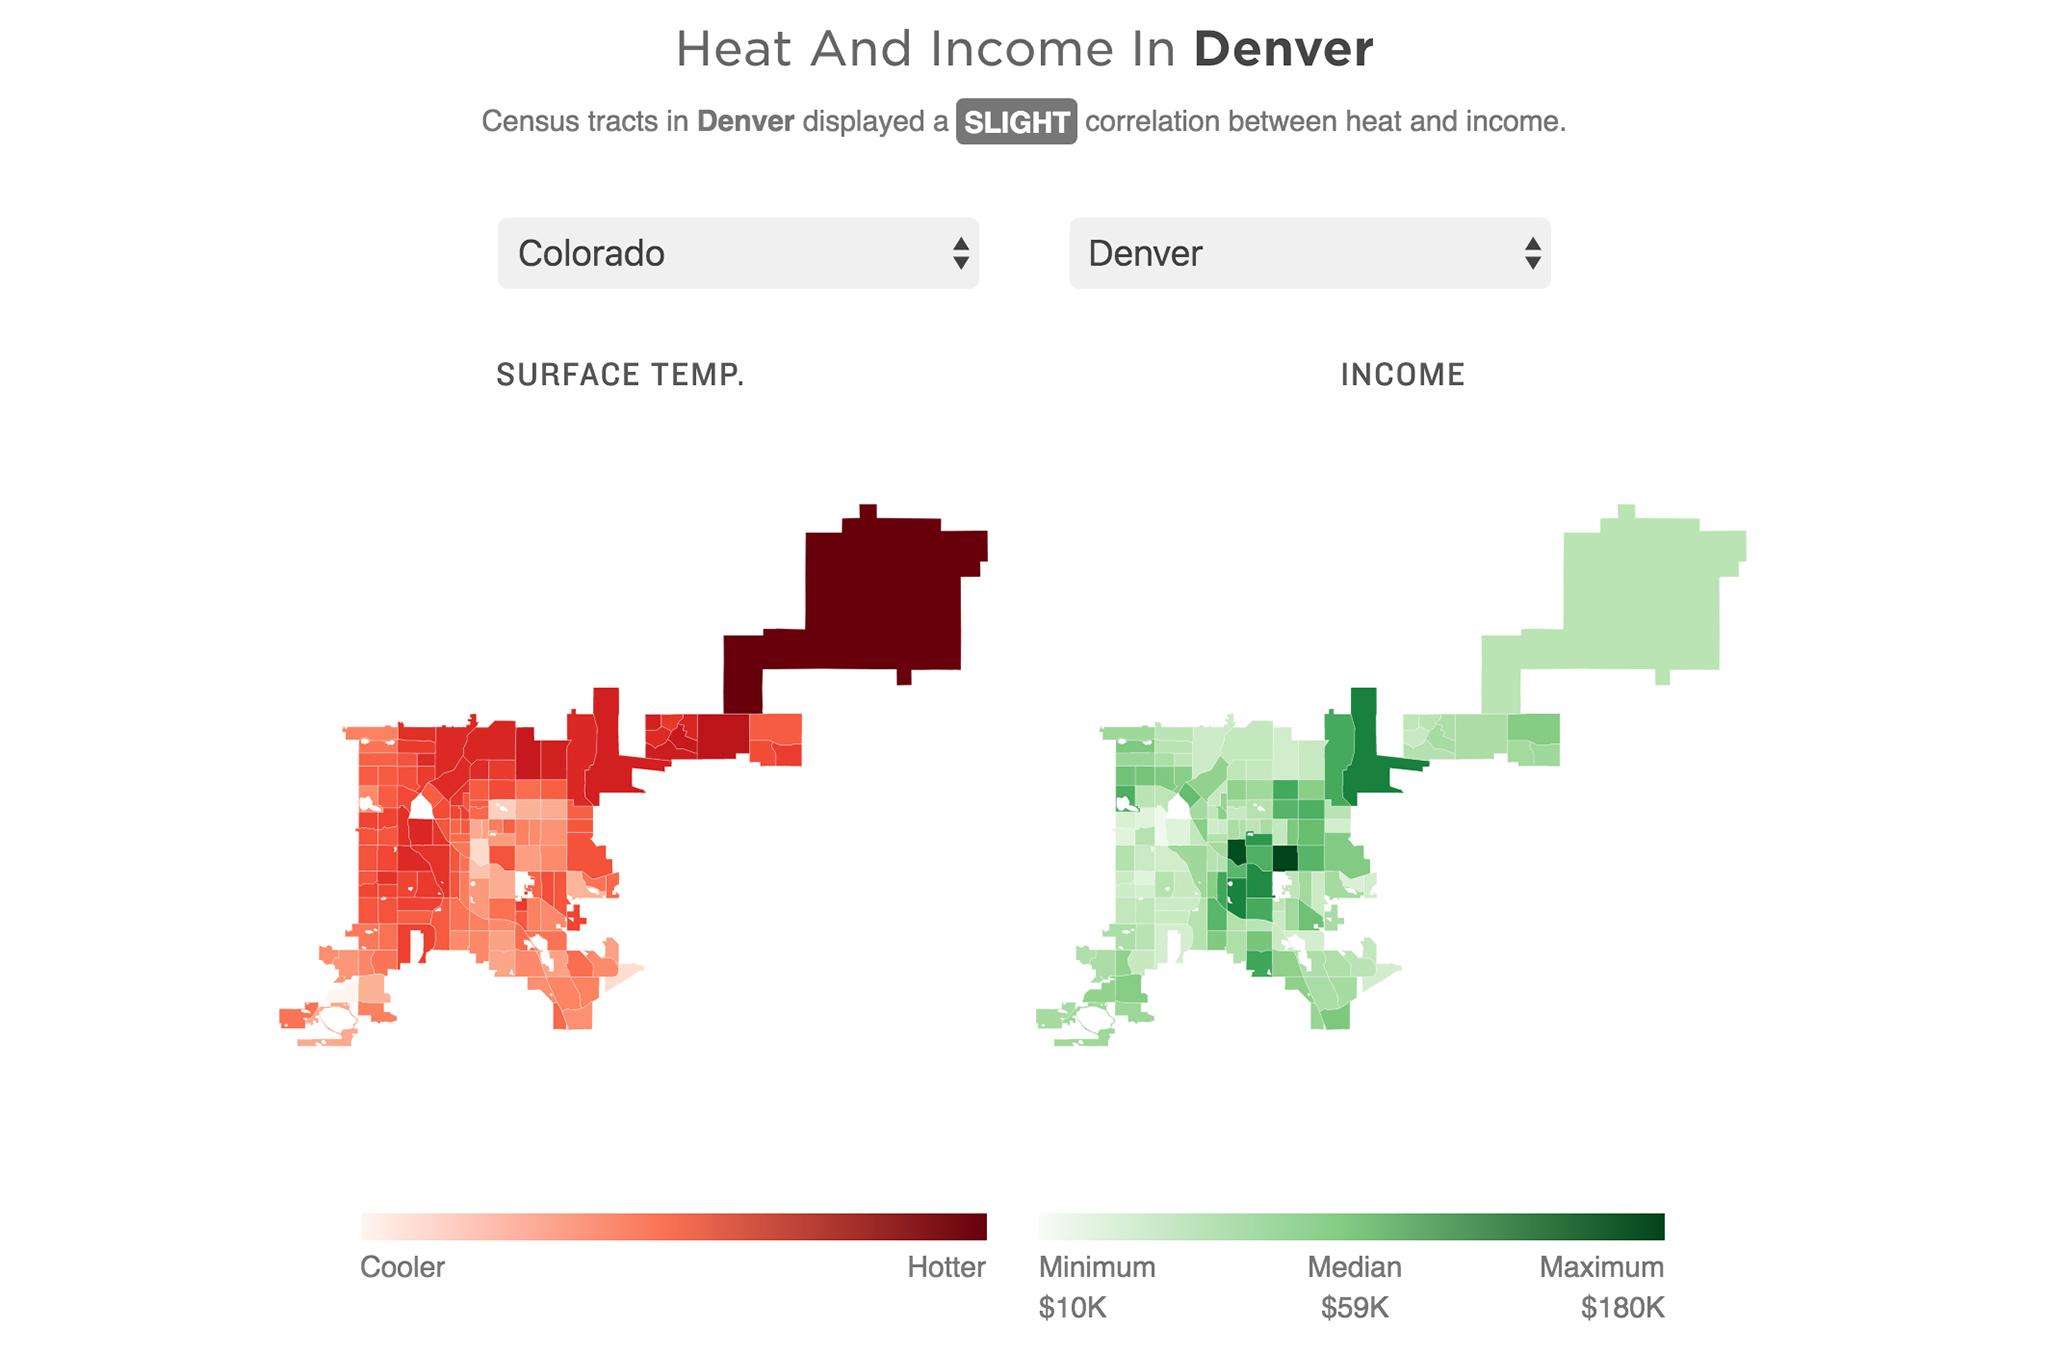
Denver, on the other hand, was only determined to have a "slight" correlation between these factors.
But data mapped by the city show that Denver is hotter in places where people are less likely to be white and more likely to earn less than people living in other neighborhoods. Other maps show how residents who are more vulnerable to high heat often live in areas where the problem is worse.
In other words, the "slight" correlation NPR found may simply demonstrate how changing demographics in gentrifying neighborhoods complicate their analysis.
Who's facing the heat?
Anderson and McMinn's maps show that Denver's hottest areas generally follow the "inverted L" shape Denverite wrote about last year. That shape suggests people living on the city's western and northern bands are less likely to be white, more likely to be under-educated, more likely to be displaced and more likely to live without a dense tree canopy.
But the City and County of Denver has actually looked into the issue of heat vulnerability, so we'll use the maps created in that analysis to compare with measurements used by Anderson and McMinn for their story.
While the city's maps support their thesis, it's not a perfect comparison.
Generally, these are the Denver areas more likely to experience hotter temperatures: areas with more people of color, more households earning under $30,000 a year, more people without a high school diploma, more households with limited English language ability and more households with less access to a car. Northeast Park Hill, Elyria Swansea, Sun Valley and Valverde are among the neighborhoods consistent with these trends.
But some demographic factors seem to predict high-heat exposure more than others. Residents in Montbello, for instance, are more likely to be people of color but are also more likely to have access to a car and earn more than $30,000 a year. Still, Anderson and McMinn's map shows temperatures there are pretty high compared to other parts of the city.
Need a refresher on the city's neighborhoods? Click here.
Denver's analysis states that race is "highly correlated to heat vulnerability," which means people of color are more likely to be affected by high heat, let alone experience it.
Higher wages may mean residents are more likely to afford air conditioning in their homes. Access to a car means residents won't likely be walking around in the heat to catch a bus. Social isolation, which includes lower rates of vehicle access and higher rates of linguistic isolation, mean residents "are less able to access services and resources in the event of extreme heat," according to Denver's report.
While Montbello scores well in other areas, residents there are more likely to have adult diabetes. According to city's analysis, that makes them less able to "thermo-regulate and adequately respond to extreme heat events."
Like the other demographic profiles listed in this section, rates of adult diabetes are more likely to be found on the outside of Denver's "inverted L."
Social factors aren't the only things that correlate with higher temperatures.
Many of Denver's hottest areas tend to be less white and less wealthy, but the eastern half of Stapleton seems to buck that trend.
Despite higher incomes, higher rates of education, more access to vehicles and less linguistic isolation, it registered some of the highest temperatures in the city.
That brings us to our next comparison: heat and the built environment.
While people living in Stapleton don't match demographic profiles of other hot neighborhoods, it's eastern half is as tree-barren as Northeast Park Hill, Elyria Swansea, Sun Valley and Valverde.
A lack of heat-deflecting greenery and a prevalence of heat-absorbing asphalt and concrete contribute to the "urban heat island effect," which the EPA says can render a city warmer than its surroundings by a difference of five degrees Fahrenheit. The phenomenon is one reason residents raised and passed a ballot initiative in 2017 that required renovations and new structures plant green roofs or buy in to a menu of other options that reduce heat island effect.
Lowry Field, which is also fairly white, educated and has low rates of poverty, measured moderately hot in Anderson and McMinn's report. Like the east half of Stapleton, Lowry has fewer trees than surrounding areas. It also has more impervious surfaces than surrounding areas.
The city's analysis used all of these factors -- tree canopy, impervious surfaces, prevalence of adult diabetes, poverty, race, access to vehicles and more -- to calculate a "Heat Vulnerability Score" for each of its census tracts. Lowry and east Stapleton were labeled with a "medium-high" vulnerability score. Neighborhoods on the northern and western sides of the inverted L were most likely to be labeled "high" vulnerability.
Lots of city data supports the NPR story's findings, so why the "slight" correlation designation?
There's one big thing about Anderson and McMinn's algorithm-fueled analysis that probably skews their data. Denver's DIA neighborhood was measured as one of the hottest and is shown to contain a medium level of income, but nobody really lives there at the moment. Their map did leave out the Auraria campus, which is largely uninhabited.
But beyond that, rapid gentrification in some neighborhoods is likely changing who lives in some places that were historically hotter than others. That demographic shift may also change environmental factors that affect temperature balances across the city.
Five Points has, perhaps, experienced the highest-profile gentrification of any neighborhood across the city. While the census tract surrounding Welton Street is as hot as places like Elyria Swansea and Sun Valley, the city's heat vulnerability analysis shows demographics don't quite match those in other places. The neighborhood was labeled with medium scores for poverty, whiteness and vehicle access.
Austin Troy, a professor at the University of Colorado Denver who chairs its Urban and Regional Planning department, told Denverite that a lot of research shows a correlation between income and tree cover. But, he added, there's no research suggesting causality.
It's possible wealthier homeowners plant more trees as they move into areas that were once poor and unshaded, but he said it's just as likely that they choose to move into neighborhoods because of their existing tree cover.
"I do think, though, that there's anecdotal evidence that planting by private owners is frequent in newly gentrifying neighborhoods," he wrote in an email.
Kim Yuan-Farrell is executive director of The Park People, an organization that advocates for green space and gives saplings away each year to people who can't afford them. Her assessment mirrored Troy's. She told Denverite: "Generally, the wealthier the neighborhood, the more forest cover you see."
But she also said things are more complicated than that. People who buy old homes in gentrifying neighborhoods, she said, may be likely to cut down old trees in yards when they scrape old houses to make room for new buildings. That could show thinner canopy coverage in changing areas. Her organization hasn't done any formal study on the topic, but she believes redevelopment is "definitely a component."
In the short-term, it's possible gentrifying neighborhoods could lose trees and become hotter.
"Because trees grow so slowly," Troy said, "it might be decades before there's a true mature canopy in these areas."
On the other hand, Yuan-Farrel said, more and more multi-family buildings have replaced single-family homes.
"That can really impact the existing canopy," she said. "What space is being left for trees?"
So it's still somewhat unclear how gentrifying neighborhoods may affect temperatures.
For now, Five Points still has as scant tree canopy and as many impervious surfaces as any neighborhood with a "high" heat-vulnerability score, though the neighborhood is currently designated as "high-medium" vulnerability.
Meg Anderson, who co-wrote the NPR story said gentrification "totally complicates things."
In an email, she told Denverite that Baltimore, where she and her colleagues did most of their "on-the-ground reporting," did not demonstrate a high relationship between cashflow and extreme temperatures.
"Part of the reason the correlation between heat and income is fairly low is because there's a big swath of the city that's been gentrified," she said.