People say that Denver's grown a lot in the past decade -- and it's true. Of course it's grown a lot more over the past 140-some years, and it's kind of mesmerizing and fun to watch where and when the growth happened.
Just take a look at Denverite's Chart of the Week using data from the Denver Assessor's Office.
Then there's the individual neighborhoods. For example, here's how Capitol Hill exploded:
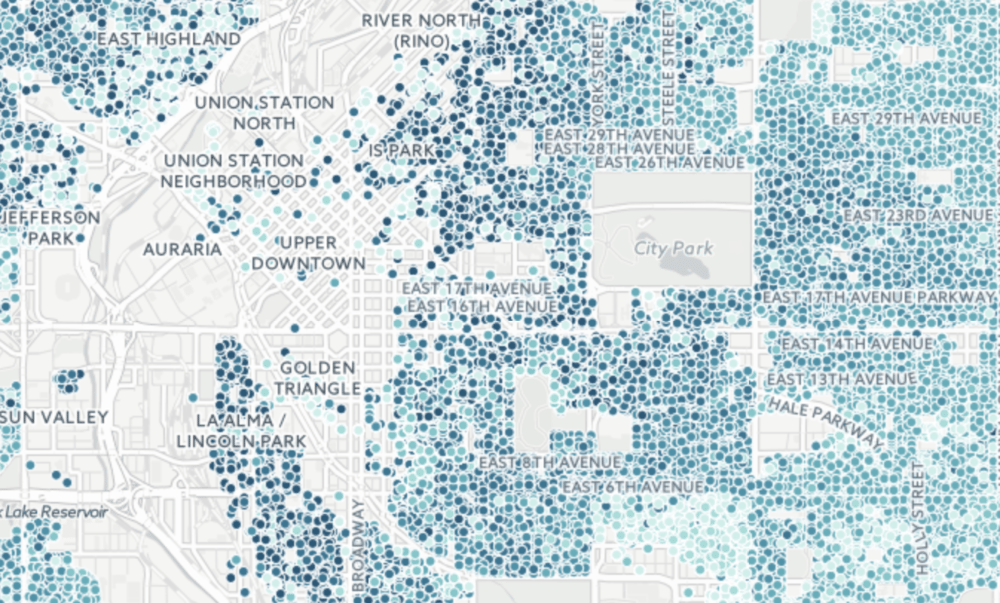
Denver's residential housing summarized by year built is also below, minus the moving parts. The places with lighter blue are newer homes and the darker blue dots are older homes.
Many of the older Denver houses are brick, and you can see a bit of the overlap in this map of Denver exteriors:
As reader Jeremy Meyer pointed out, the preponderance of older homes utilizing brick was in part due to a city mandate following a city-wide fire April 1863. A YourHub article explains further:
"Because of this wholesale devastation, the city government passed an unusual law which came to be known as 'The Brick Ordinance.' This law, in effect until the 1940’s mandated brick construction for all new buildings in the city. It is because of this ordinance that the LoDo district has the large group of brick buildings today."
But really, there isn't an obvious correlation in the data between housing exteriors. I think that part of the reason lies in the second map, specifically in the downtown core.
While Denver has continued to grow outward, at least downtown, one can see glimmers of building more densely and adding to places where people already live. Maybe Denverite can revisit this in another 50 years and see if we've stopped building outward.