If money could talk and it had opinions about Denver real estate, here's what it would tell you about the hottest neighborhoods in the city right now.
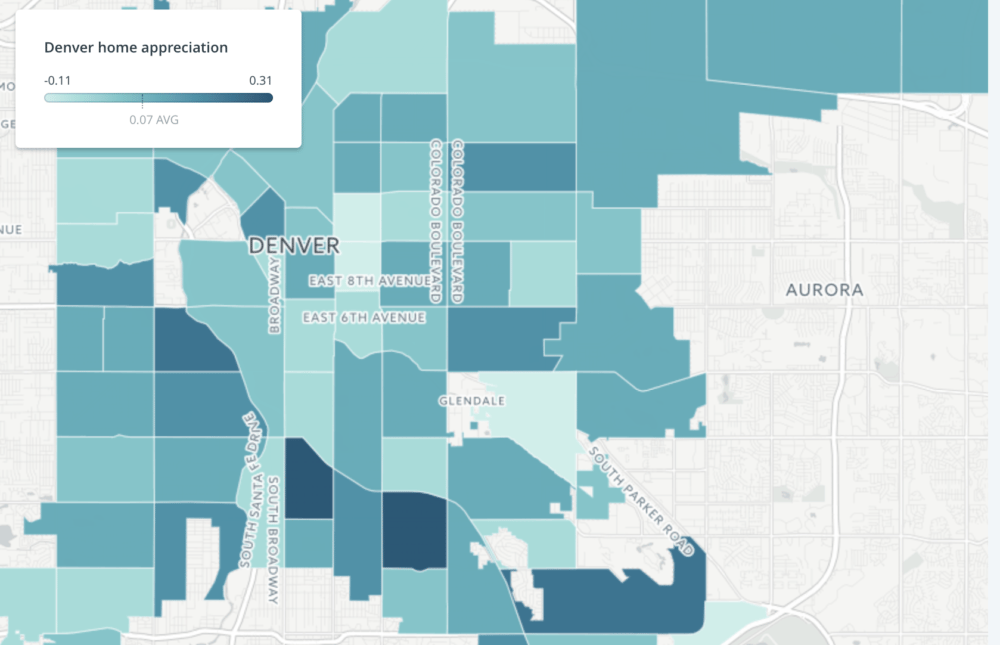
In this Chart of the Week, Denverite examined how median home prices in each neighborhood have changed from 2016 to 2017 so far.
First, Denver's southern neighborhoods have seen the biggest increase in home sale prices so far this year. In 2017 so far, Platt Park, University Park and Hampden all had median sold home price increases of over 20 percent when compared to last year.
But also, neighborhoods where homes sold for less money in 2016 had notable price increases in 2017 so far. If that sounds familiar, that's because the same thing happened with new Denver home values released this year.
So Valverde and Villa Park, in addition to seeing big home value increases, had some of the biggest home price appreciation so far this year too.
Want to see how your neighbhorhood ranked? Check out the table below.
| Neighborhood | 2016 Median sold home price | 2017 Median sold home price | Percent increase |
| Platt Park | $534,250 | $701,125 | 31.2% |
| University Park | $530,000 | $692,500 | 30.7% |
| Hampden | $205,000 | $250,500 | 22.2% |
| Valverde | $230,000 | $275,000 | 19.6% |
| Hilltop | $852,500 | $1,012,500 | 18.8% |
| Villa Park | $251,250 | $295,000 | 17.4% |
| University | $434,500 | $507,500 | 16.8% |
| CBD | $375,000 | $435,000 | 16.0% |
| Chaffee Park | $296,000 | $343,250 | 16.0% |
| Jefferson Park | $479,000 | $553,463 | 15.5% |
| College View - South Platte | $231,000 | $264,700 | 14.6% |
| North Park Hill | $425,000 | $486,000 | 14.4% |
| Southmoor Park | $462,000 | $525,000 | 13.6% |
| Athmar Park | $268,500 | $304,485 | 13.4% |
| Whittier | $416,500 | $470,000 | 12.8% |
| Lowry Field | $550,000 | $620,000 | 12.7% |
| Rosedale | $464,900 | $524,000 | 12.7% |
| Barnum | $239,000 | $268,300 | 12.3% |
| Belcaro | $824,625 | $925,000 | 12.2% |
| Clayton | $355,000 | $398,000 | 12.1% |
| Cole | $362,400 | $405,000 | 11.8% |
| Barnum West | $247,500 | $275,750 | 11.4% |
| Westwood | $225,000 | $250,000 | 11.1% |
| Hale | $395,000 | $435,000 | 10.1% |
| Montbello | $250,000 | $275,000 | 10.0% |
| Globeville | $250,000 | $272,500 | 9.0% |
| Capitol Hill | $271,000 | $295,000 | 8.9% |
| Harvey Park | $285,000 | $310,000 | 8.8% |
| Ruby Hill | $266,750 | $290,000 | 8.7% |
| University Hills | $365,558 | $395,918 | 8.3% |
| Washington Park | $740,000 | $800,000 | 8.1% |
| Stapleton | $495,000 | $535,000 | 8.1% |
| Congress Park | $520,000 | $561,000 | 7.9% |
| Virginia Village | $405,000 | $436,000 | 7.7% |
| Windsor | $169,500 | $182,000 | 7.4% |
| Gateway - Green Valley Ranch | $293,403 | $315,000 | 7.4% |
| Indian Creek | $229,500 | $245,000 | 6.8% |
| Baker | $421,500 | $449,500 | 6.6% |
| East Colfax | $272,875 | $291,000 | 6.6% |
| Regis | $380,000 | $405,000 | 6.6% |
| Mar Lee | $260,000 | $277,000 | 6.5% |
| Sunnyside | $425,000 | $450,000 | 5.9% |
| Hampden South | $247,000 | $260,750 | 5.6% |
| Five Points | $446,000 | $470,000 | 5.4% |
| Berkeley | $500,000 | $522,950 | 4.6% |
| West Highland | $510,800 | $532,750 | 4.3% |
| North Capitol Hill | $377,250 | $393,000 | 4.2% |
| Northeast Park Hill | $335,000 | $347,500 | 3.7% |
| Lincoln Park | $306,000 | $315,000 | 2.9% |
| South Park Hill | $580,000 | $597,000 | 2.9% |
| Union Station | $534,500 | $550,000 | 2.9% |
| Wellshire | $650,000 | $665,000 | 2.3% |
| Skyland | $401,000 | $409,900 | 2.2% |
| Cherry Creek | $765,000 | $780,000 | 2.0% |
| Fort Logan | $332,500 | $338,500 | 1.8% |
| Highland | $525,000 | $531,450 | 1.2% |
| Washington Park West | $595,000 | $600,000 | 0.8% |
| City Park | $475,500 | $479,250 | 0.8% |
| Elyria Swansea | $220,000 | $221,000 | 0.5% |
| Cory - Merrill | $620,000 | $621,250 | 0.2% |
| Harvey Park South | $327,750 | $325,500 | -0.7% |
| Speer | $330,000 | $327,500 | -0.8% |
| Montclair | $450,000 | $445,000 | -1.1% |
| Overland | $335,000 | $330,000 | -1.5% |
| West Colfax | $489,000 | $479,000 | -2.0% |
| Civic Center | $458,750 | $444,000 | -3.2% |
| Sloan Lake | $520,000 | $502,043 | -3.5% |
| Bear Valley | $320,750 | $309,250 | -3.6% |
| Goldsmith | $148,000 | $142,500 | -3.7% |
| Country Club | $973,250 | $930,000 | -4.4% |
| Marston | $275,000 | $256,500 | -6.7% |
| City Park West | $460,000 | $422,760 | -8.1% |
| Cheesman Park | $335,000 | $305,500 | -8.8% |
| Washington Virginia Vale | $285,000 | $253,200 | -11.2% |
Methodology: I used Real Property and Sales data from the Denver data portal for this story. First, I selected sales from 2016 and 2017, then I chose rowhouses, condominiums and single family homes sales for my data set.
From there, I filtered by deed type to exclude deeds that aren't typically part of a home sale, such as a parcel split. I excluded sales where the grantor and the grantee were the same person, as well as sales where the sale price was less than $500. The purpose of that is to remove more "deed cleanups."
Next, in the event that the same home sold multiple times, I used the last sale in the hopes that it captured owner-occupancy. For example, in Stapleton, some new construction is built by one company, sold to another company, before it's finally sold to an individual. By using the last sale, I felt it was more likely that it captured an arms-length sale.
Finally, each home's neighborhood was determined by which statistical neighborhood it fell in on a map. From there, it was a matter of calculating median prices by 2016 and 2017. Neighborhoods with fewer than 20 sales in either 2016 or 2017 were excluded.