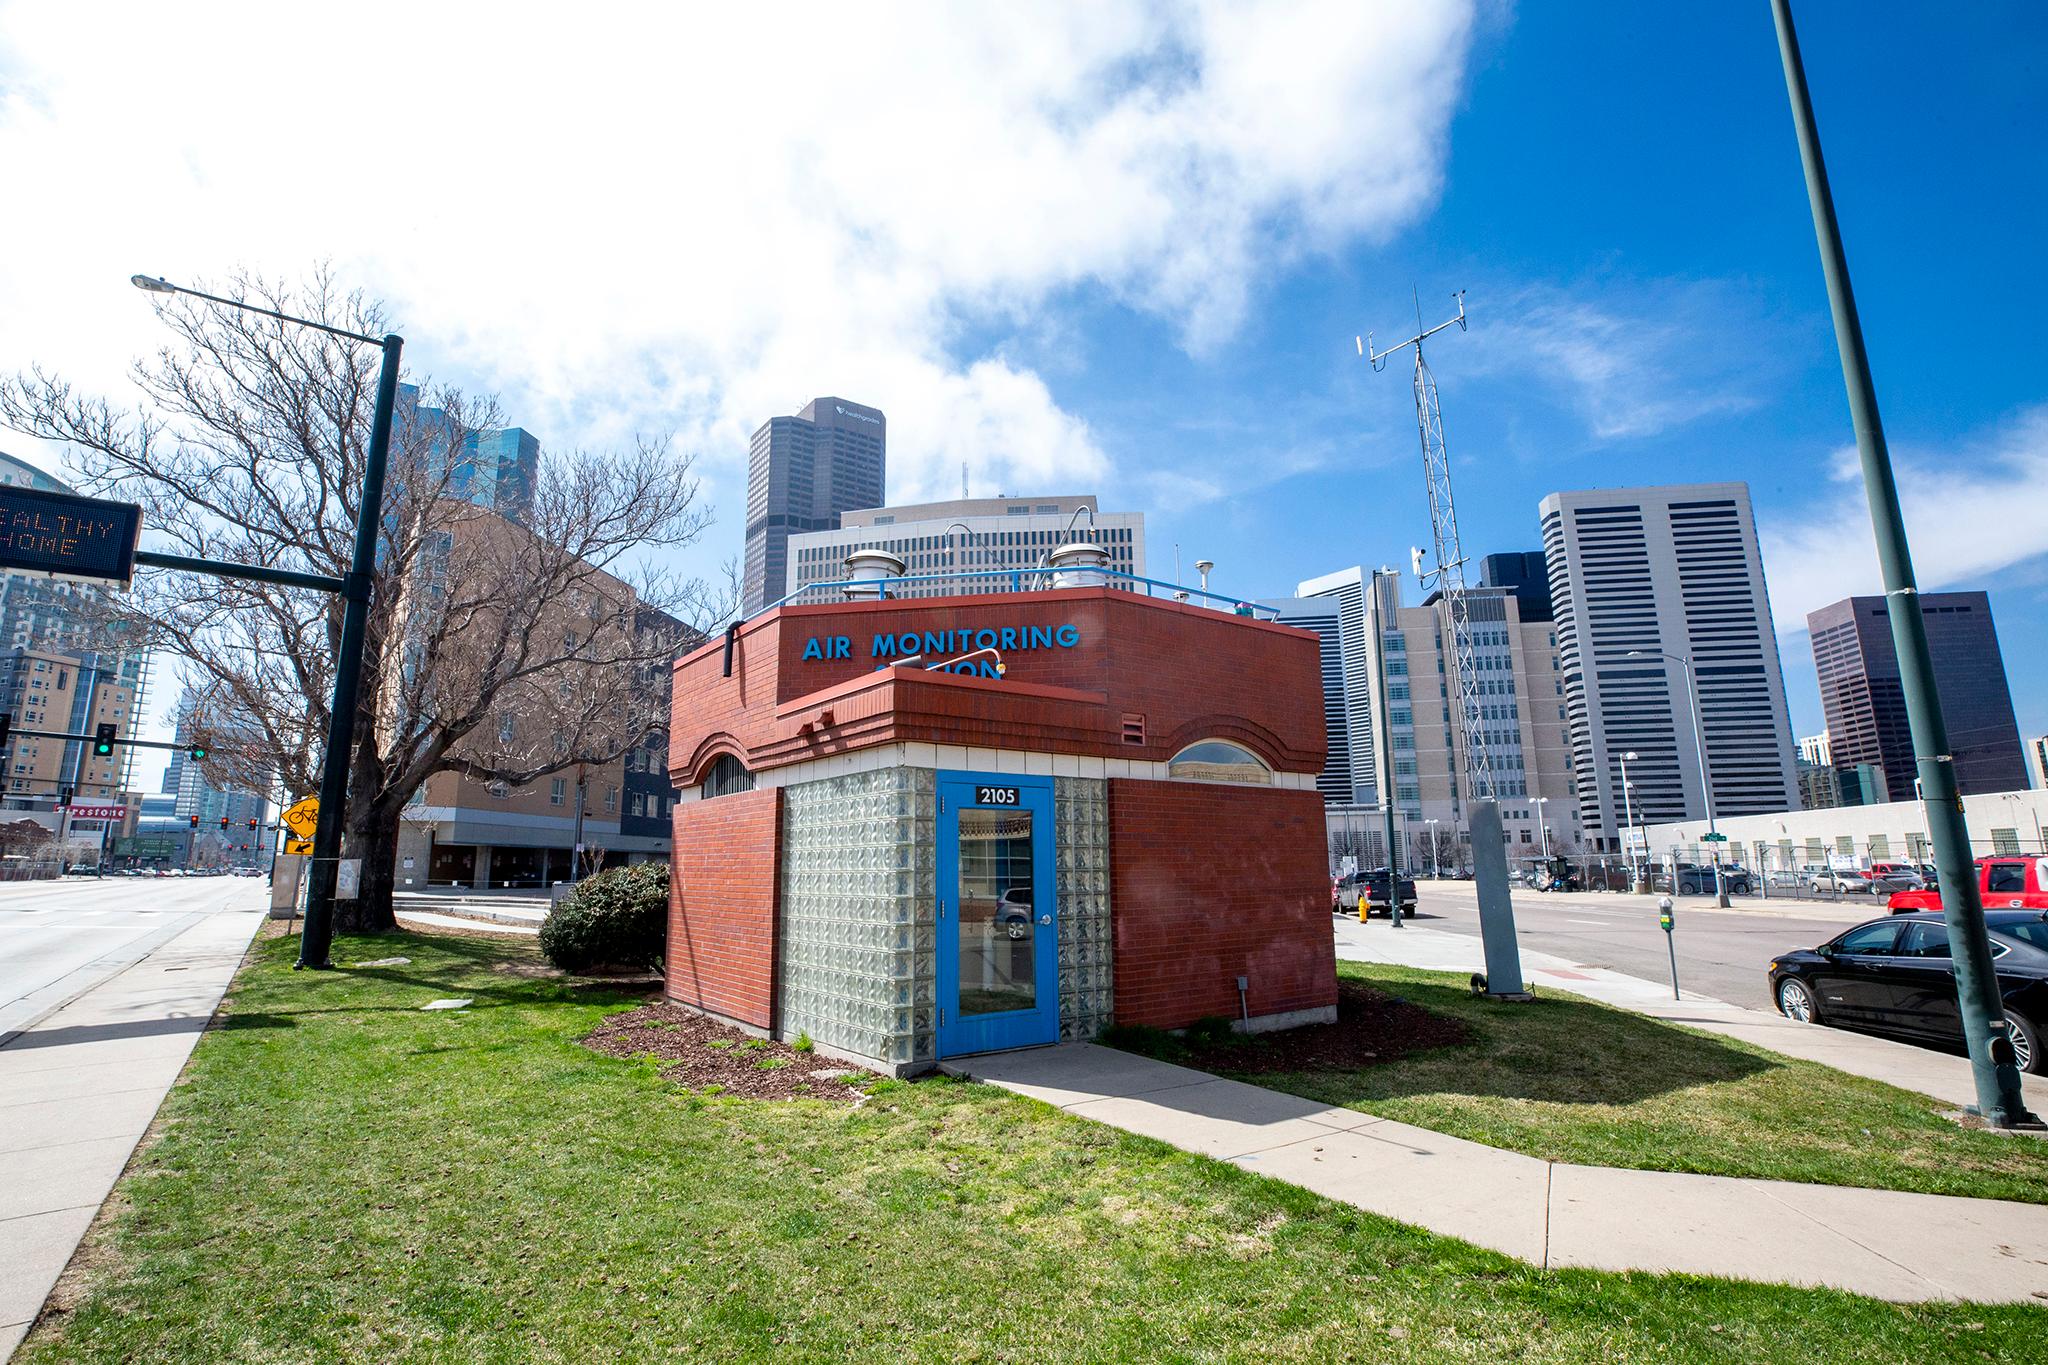
Hello, fellow air breather! Here's the latest from the State of Colorado's CAMP monitor, which you may have seen looking adorable at the corner of Broadway and Champa Street.
(Note: The date on this post refers to the day it was first published, but the numbers are fresh!)
Current AQI
If you'd like to see readings from another part of town, you might try taking a look at PurpleAir's map of the city - it tends to update sooner, but please note the numbers there can skew higher than reality.
This usually updates once an hour with readings from the last full hour. The short answer why: Science doesn't have a reliable way to deliver those readings to us faster. AQI is always an average of levels over time, so it takes time to get correct results. EPA data can sometimes lag longer that that. This is the best the agency has for us, for now. See a full explainer on AQI below.
What is AQI?
It stands for "Air Quality Index," and it's kind of a slippery term. The idea is to take readings of air pollution over time (like you see above in the graphs) and convert them into a number that makes sense for regular folks. Any AQI reading over 100 is meant to warn people that the air outside could affect their health.
The EPA provides regular AQI data for four different compounds measured at Broadway and Champa. In Denver, PM 2.5 (in the summer) and ozone (in the winter) tend to be the worst of them. When you see a single AQI number, here or on most air quality sites, it represents the highest AQI level of all pollutants measured.
Why are these numbers delayed?
AQI can not currently be assigned to any single moment in time. Health officials are concerned about prolonged exposure to air pollution, so the index is actually an average of multiple hours.
Colorado's health department calculates AQI for most pollutants on a 24-hour average. You can see how that would be rather unhelpful in the summer, when quick-shifting winds can make the air terrible in no time.
We use what's called AQI NowCast, which is basically an EPA algorithm to shorten that averaged time. The timeframe can shift based on the season. In summer, when things can change the fastest, NowCast brings that average down to a three-hour formulation. That is still not perfect or even useful for people who want to know if it's safe - right now - to go outside.
We've spoken with a lot of air experts, and they have all said there's a need for something more immediate. 2020's intense wildfire season has only made that more clear.
When faster numbers become available, we'll make sure this page updates faster, too.
For now, the numbers presented here should give you a general idea of the air quality downtown. Just know these readings can't react super quickly to sudden changes - if it suddenly tastes like ash outside, trust your tongue and not the readings.
Like we said above, you can look at PurpleAir's map to see things changing closer to realtime. These are not official numbers, and they tend to skew higher and higher than reality as they encounter dense smoke pouring out of wildfires.
One more thing: Location matters.
Air quality can be extremely location-specific. Smoke could be bad in Green Valley Ranch while Barnum is breathing fine.
We simply need more sensors to find out how air pollution varies across the city. Luckily, that tech has become significantly cheaper in recent years, so we're starting to see more and more data points across town. The city, for instance, has been rolling out a bunch of PM 2.5 sensors at schools in recent years. They do not test for ozone, however.
You can take a look at sites like PurpleAir and IQAir to see data from these cheaper sensors around Denver.
We are using the monitor at Broadway and Champa because it's high-tech and offers "official" data. The air downtown is also a good place to start for this project, since sites like the EPA's AirNow portal give results for a broad swath of the Front Range, even when it says it's presenting Denver's air. We want to show you air quality in the center of town, separate from pollution levels in Boulder or Fort Collins.