Certain industrial operations are required to report the waste they produce to the Environmental Protection Agency. The program is called the Toxic Release Inventory (TRI), and in February we brought you an analysis of what that program tells us about metro-area polluters.
While TRI gives us an idea of the chemicals produced in factories and refineries around Denver, the data has nothing to say about health risks. It turns out there's a different dataset for that.
When annual TRI numbers are finalized each year, the EPA maps the data in order to communicate where industrial chemicals pose the greatest health risks. This dataset, called the Risk-Screening Environmental Indicators (RSEI) Model, breaks the country up into 810-meter squares and assigns each a "risk score" derived from all of the TRI releases recorded onsite for a given year. The latest dataset, which came out a few months ago, shows impacts from 2019. It helped us identify five hotspots for industrial pollution around the metro.
There are three major caveats. First, the maps in this story only show risk related to facilities that report to TRI; it excludes emissions from cars and smaller facilities that don't have to feed data into the system. Second, the colored squares in each map represent hazards relative to one another. Scores never indicate a particular level of danger; instead, these numbers show which areas are in worse shape than others. Third, environmental activists say the TRI system as a whole is flawed because companies report their own numbers. There have been some local headlines recently that suggest not everyone is being super-honest about their emissions. More on that last bit later.
For now, let's take a look at some maps.
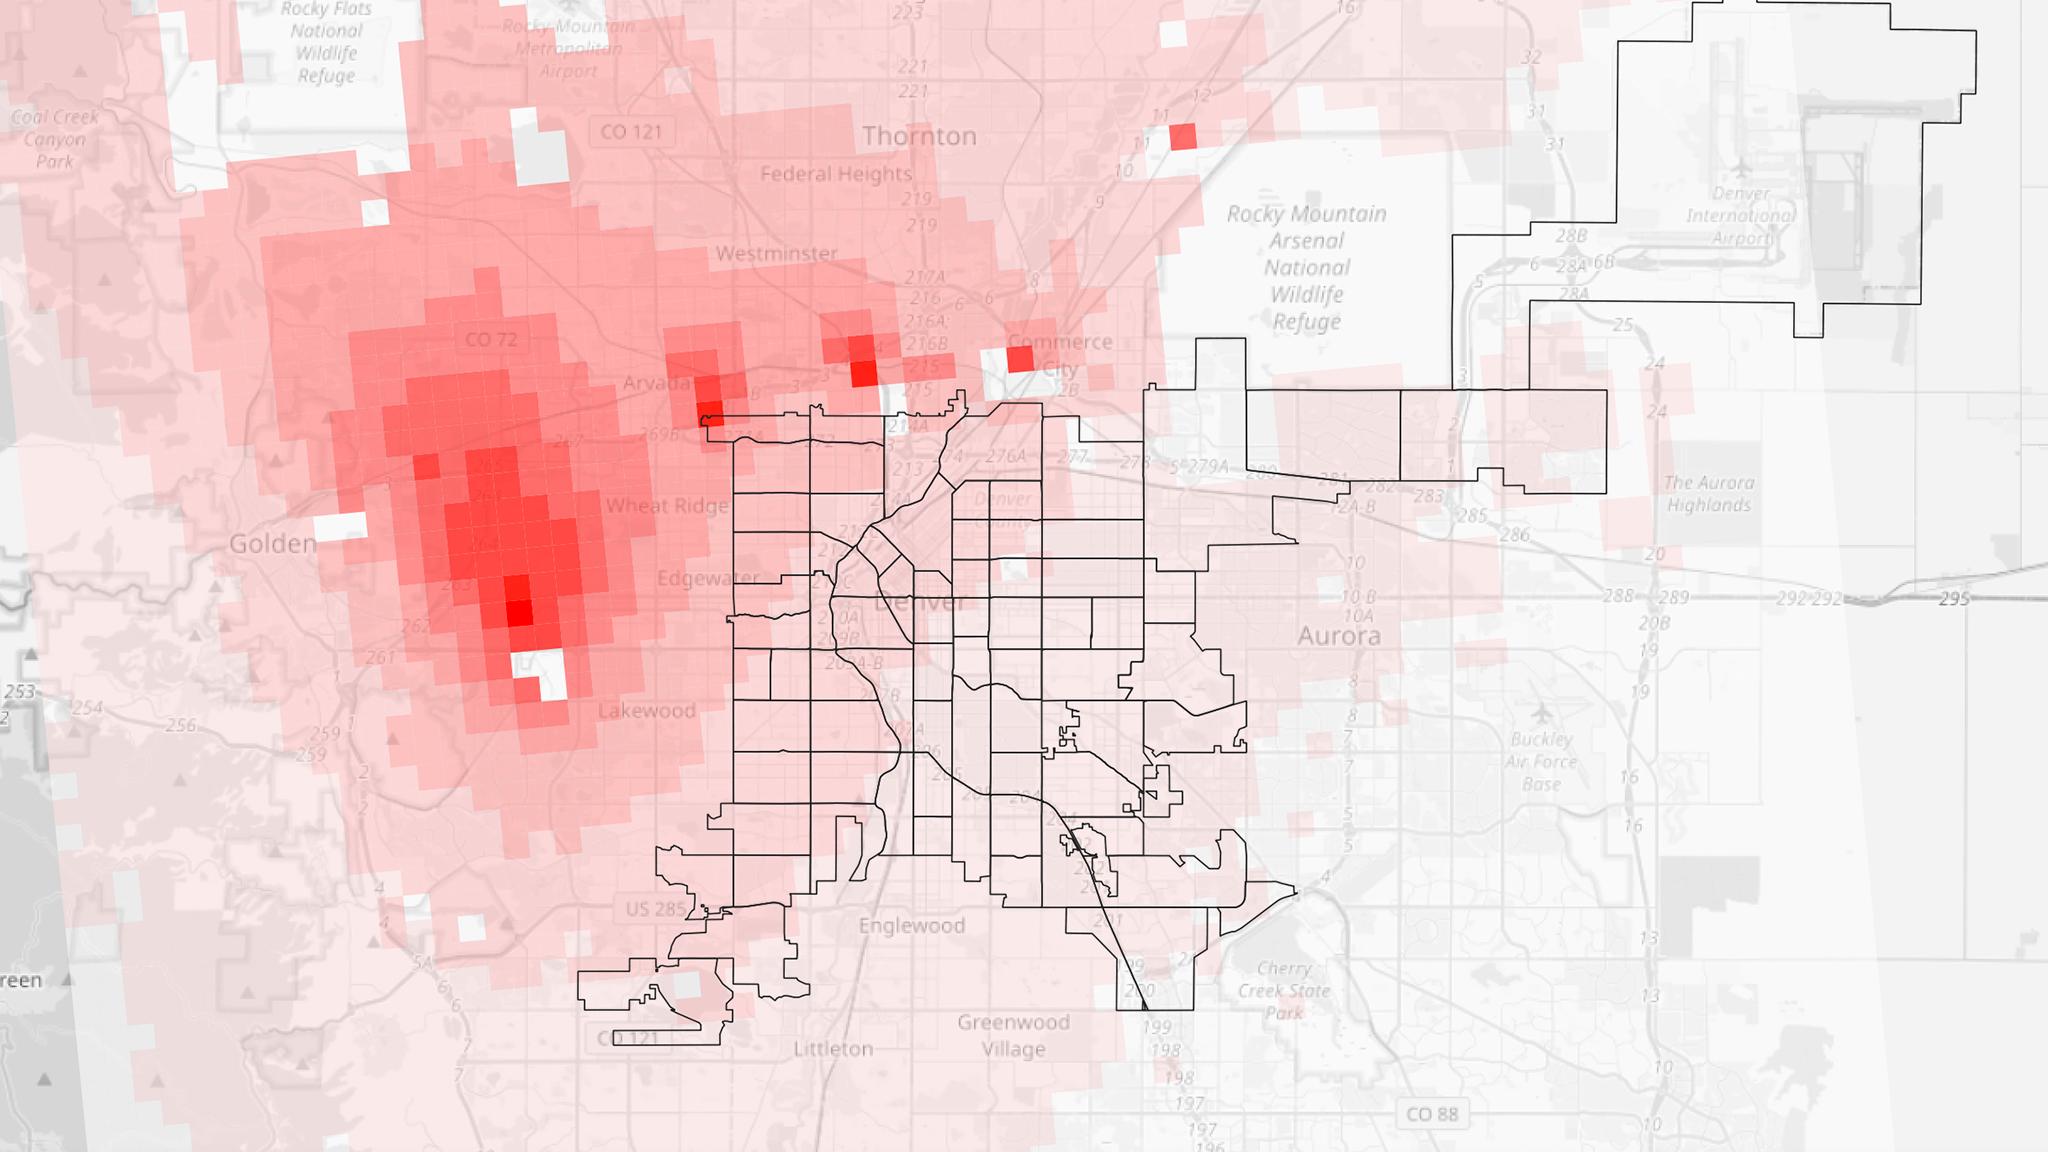
Here's the basic data on the metro:
OK, so there's not much that's "basic" about this stuff, but this map shows the EPA's risk score for each square over the metro. Darker squares represent greater risk related to industrial TRI sites. To get each square's score, the EPA multiplies the amount of each chemical in each square by a "surrogate dose," essentially a number that indicates how dangerous each chemical is to humans. Then, it multiplies that number by the population of each square and adds all of the chemical releases from one year into a single map. That's what you see above.
Here's the thing about those population numbers.
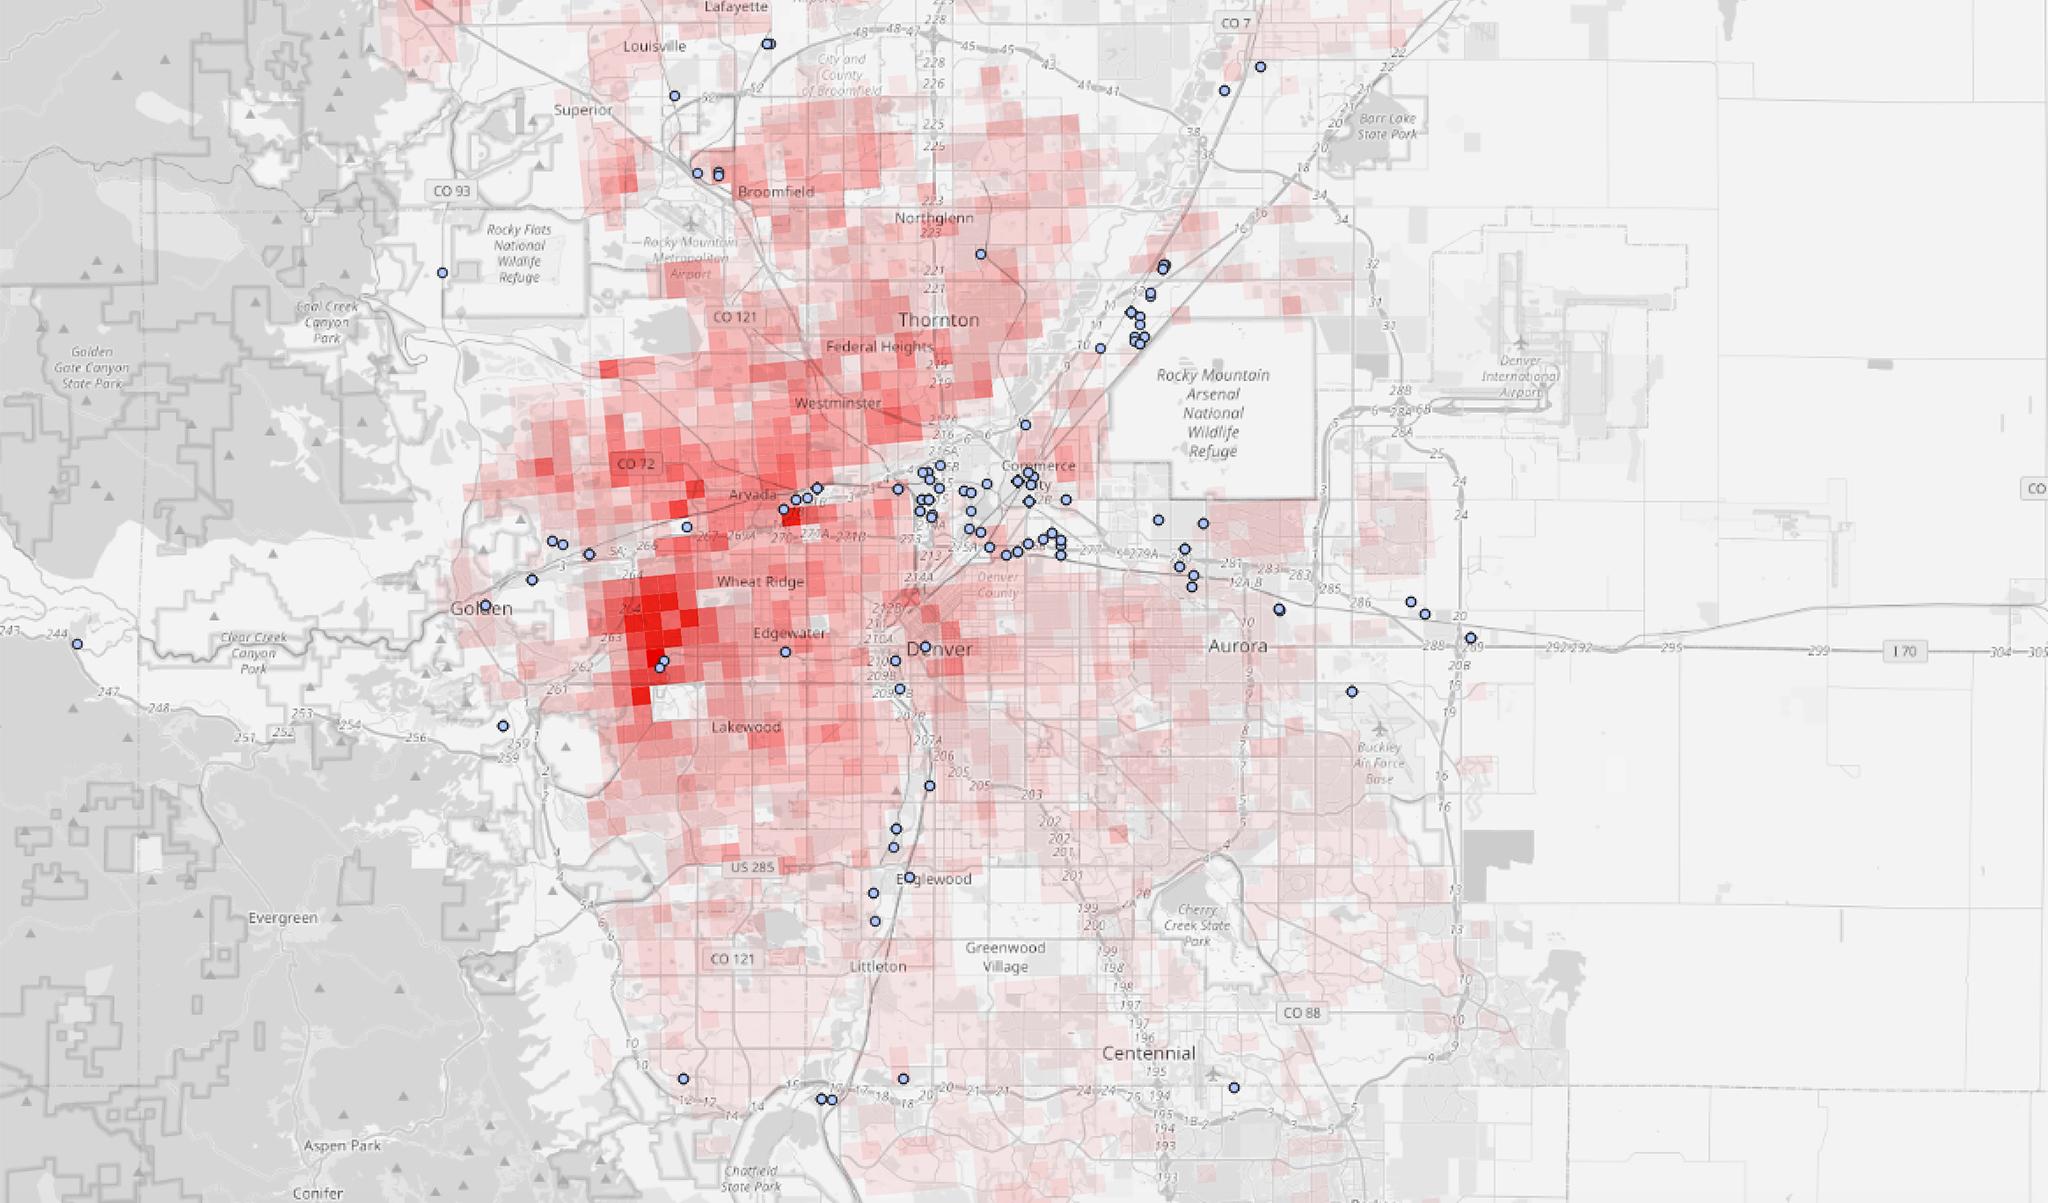
All of the EPA's recent risk score data pulls population figures from the 2010 Census, which misses a lot of the metro's growth in the last decade. But more importantly, we wanted to show risk that's unweighted by how many people live in a given square. So we re-crunched the numbers, removing population from each tract.
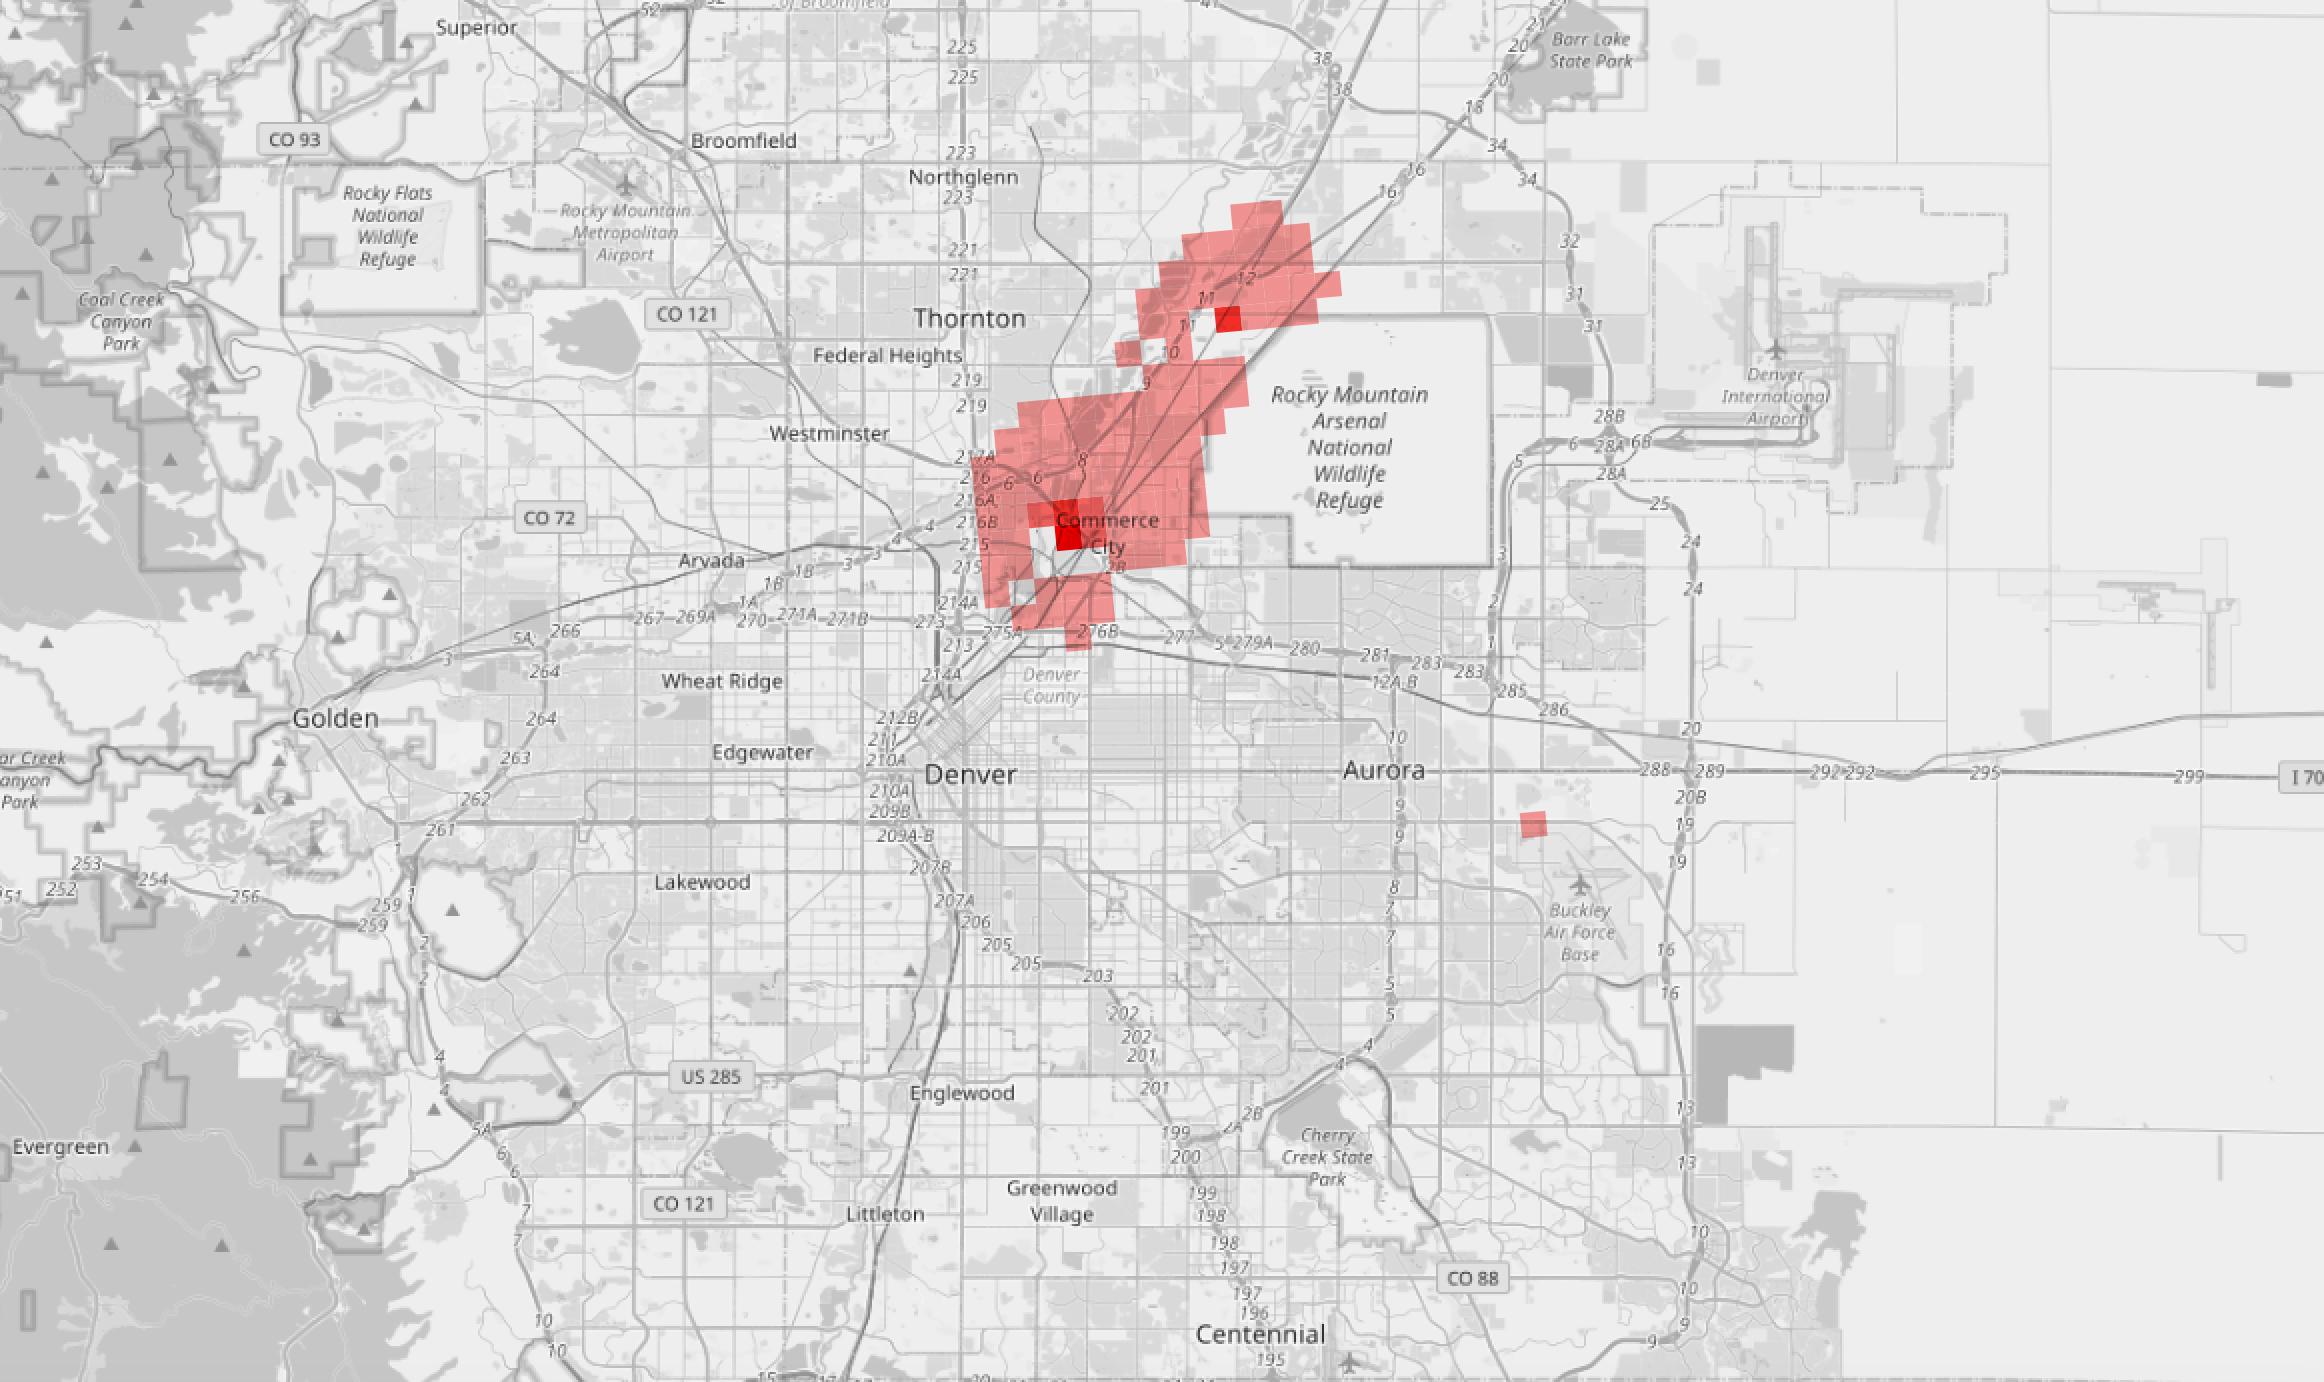
Below is a look at the metro's risk scores without population's influence. The little blue dots are TRI facilities:
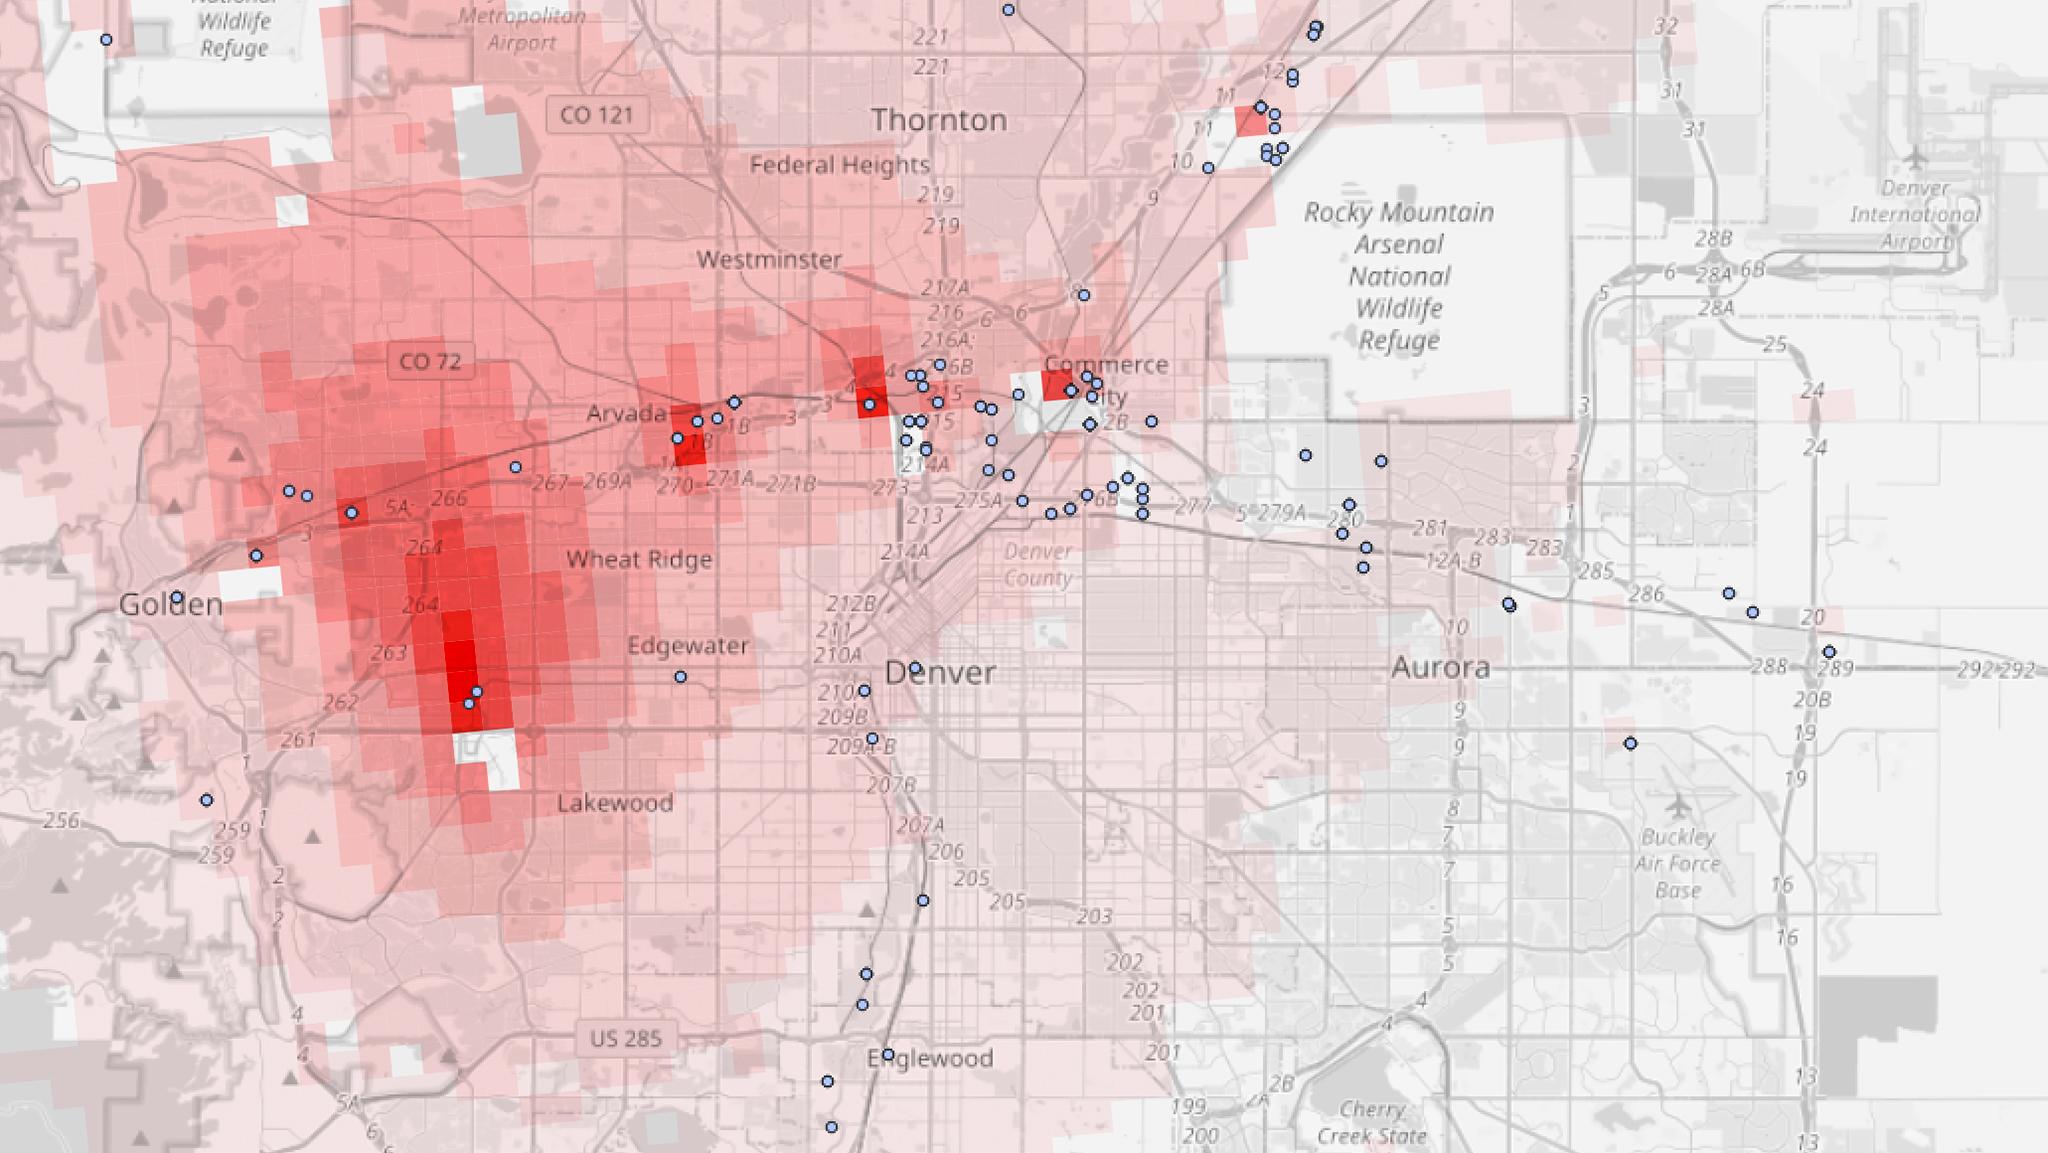
See five hotspots arcing around the west and north of city limits? That's what we'll focus on next.
About that big Lakewood plume.
The metro's largest hotspot is right over the Federal Center in Lakewood. We picked a single square in its dense center for analysis. In 2019, that square was impacted by 61 chemicals emitted in 363 separate releases by 76 facilities.
One of these releases stood out among the rest: a report of ethylene oxide emitted as "fugitive air." This means the chemical drifted into the atmosphere from things that aren't a smokestack, either by accident or through the regular course of an industrial process.
The ethylene oxide came from Terumo BTC, an international biomedical company with a facility right in the center of that big red patch on the map. According to the CDC, ethylene oxide can cause headaches, diarrhea and burns. It's also thought to cause cancer.
The chemical is worrisome enough that the EPA authored an "alert" last year listing 25 facilities whose neighbors urgently needed to be informed of ethylene oxide's heath risks. Terumo's Lakewood site was on that list. Still, the agency rolled back some regulations on the gas under President Donald Trump.
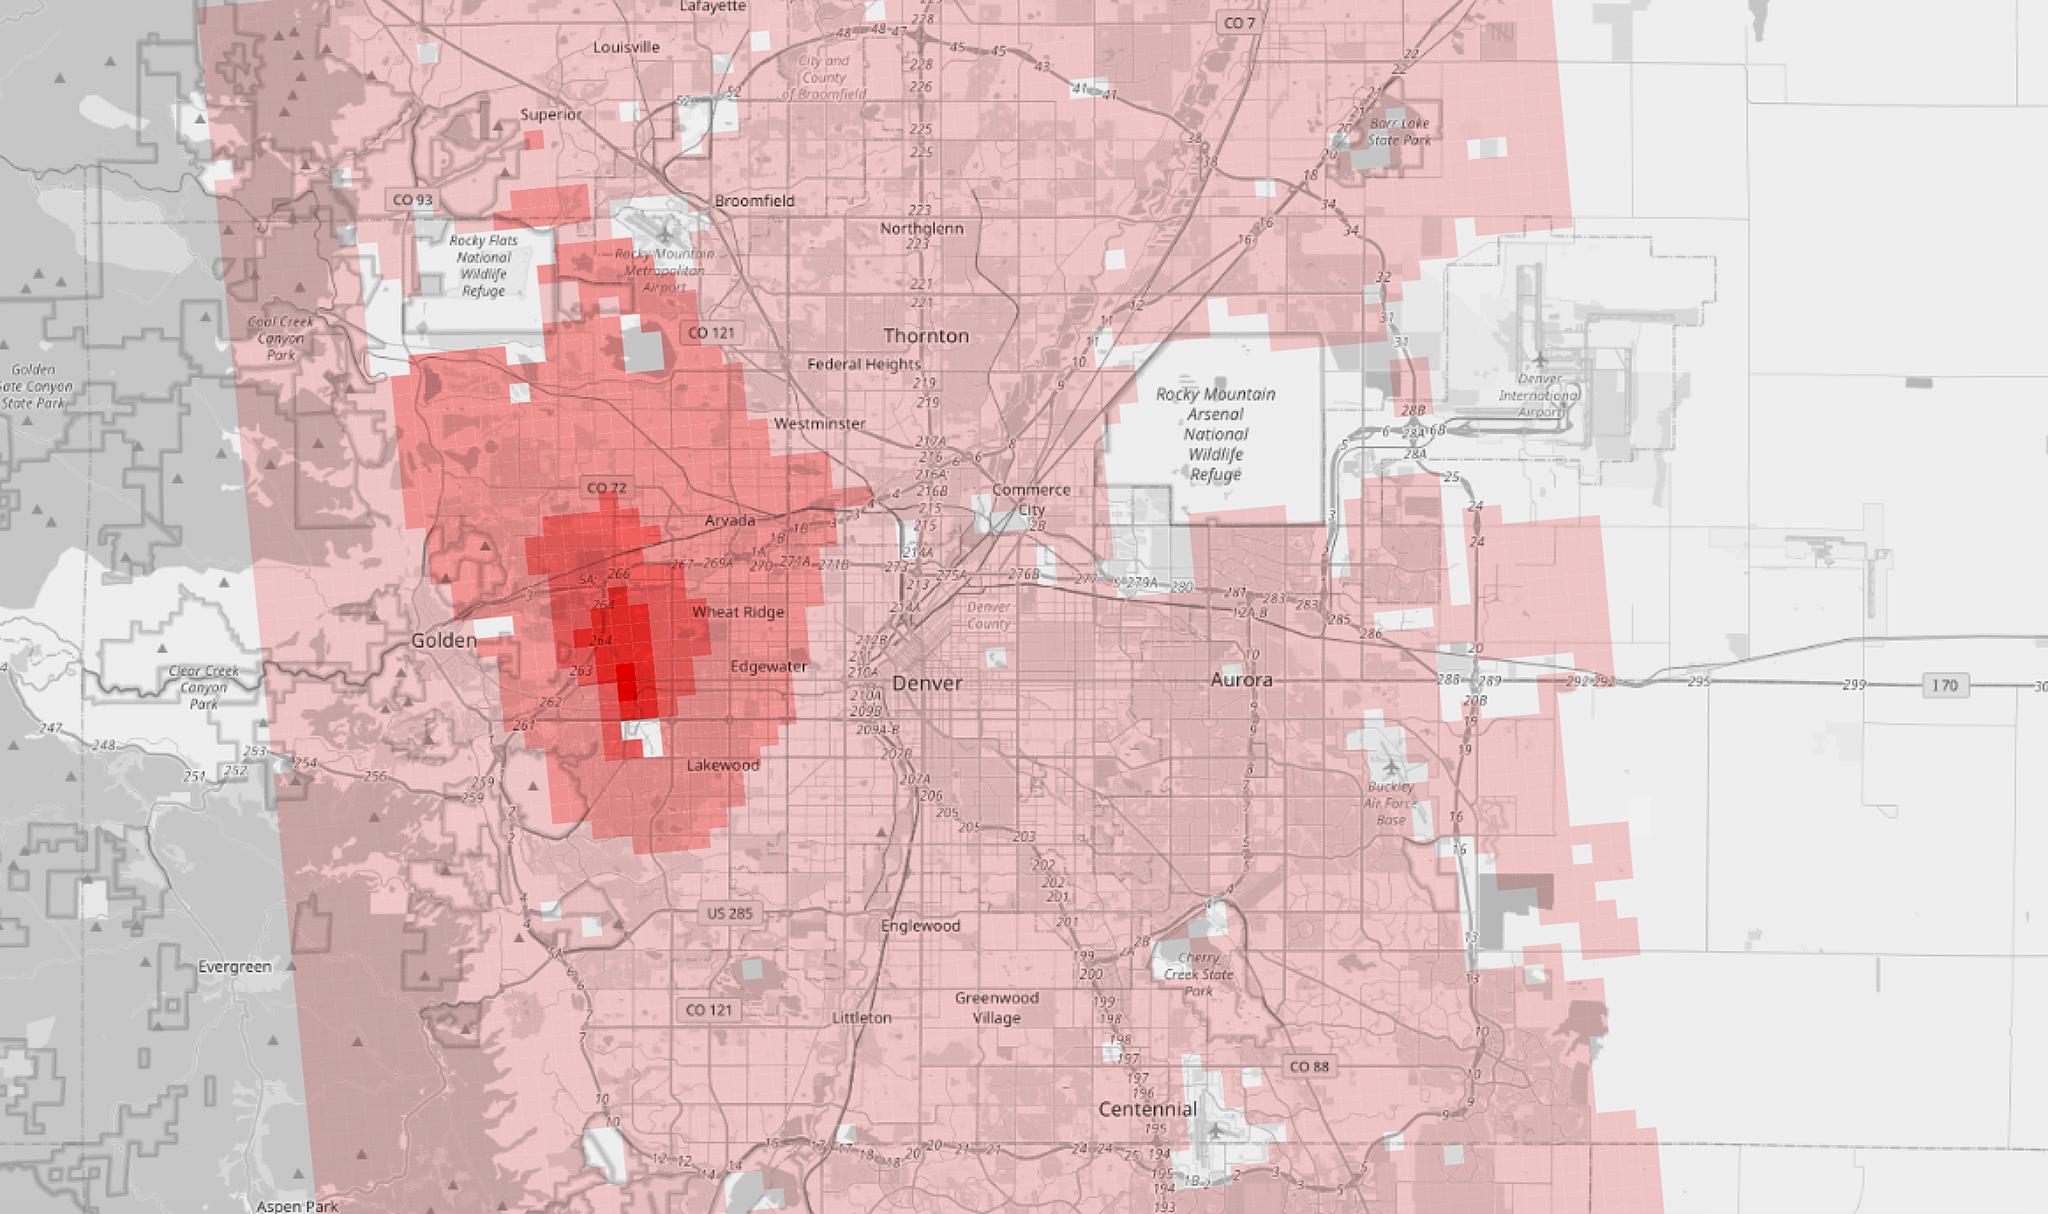
We looked at three years of RSEI maps. That big Lakewood plume looked pretty much the same in 2018 and 2017, too.
Below is a map of risk scores just from Terumo's 2019 releases, 5,026 in total. While big companies usually emit a litany of chemicals each year, all 5,026 of Terumo's releases were of ethylene oxide. According to the EPA, the entire metro has some level of risk related to Terumo's emissions.
Next: Inspiration Point and some perspective.
Moving clockwise from Lakewood, we come next to a hotspot over Arvada. The square at the center of this hotspot represents 82 companies that emitted 64 chemicals in 402 different releases in 2019. At the top of that list is Advanced Surface Technologies, Inc., with a fugitive air release of "nickel compounds." These gasses can cause dermatitis and "allergic asthma," according to the CDC, which also says it has the potential to cause cancer.
It's also the only hotspot that touches Denver proper. It overlaps with a few residential streets just over the hill at Inspiration Point Park, on the city's northwestern tip.
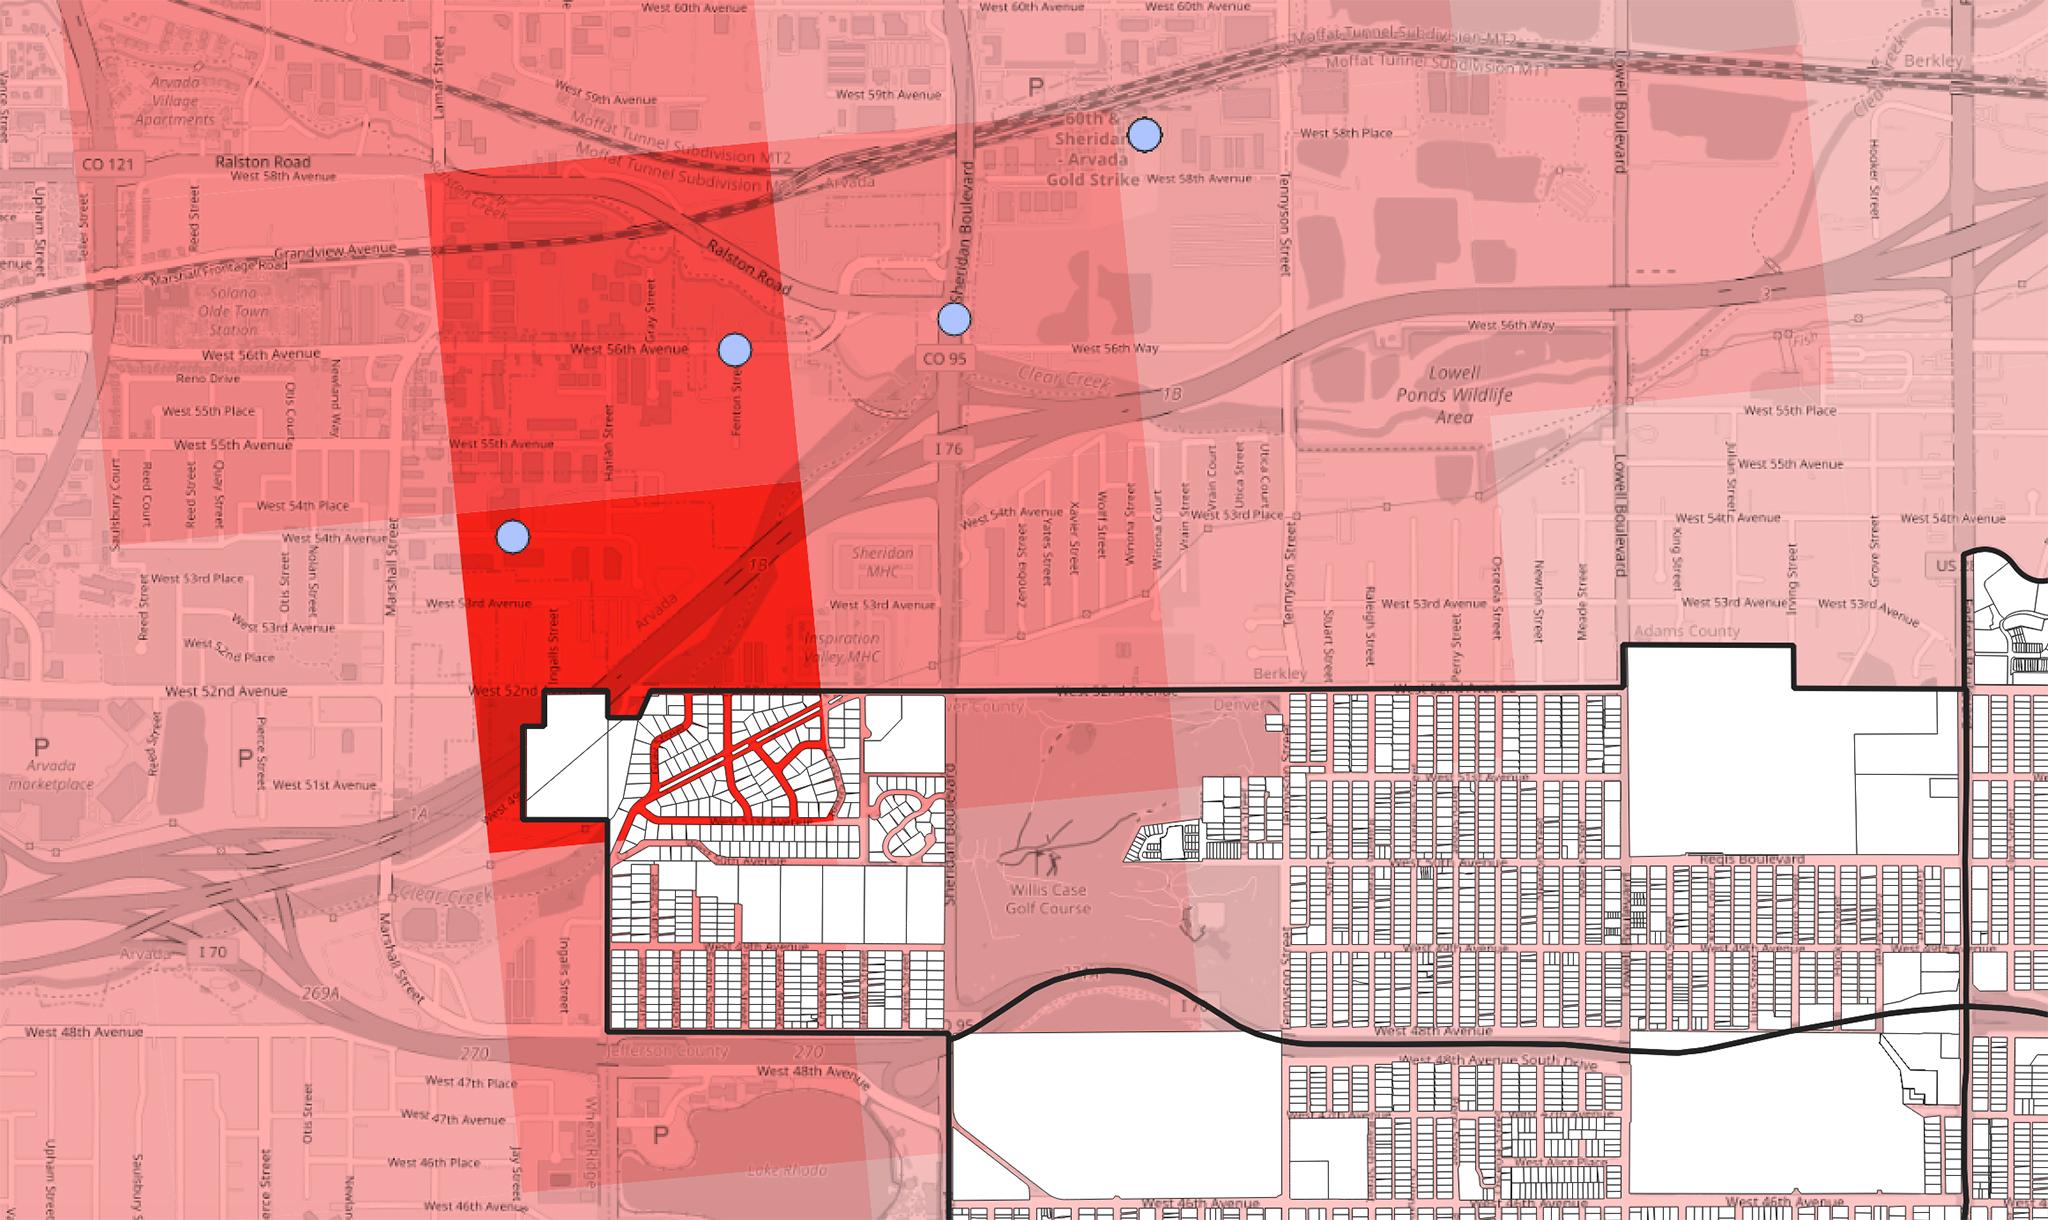
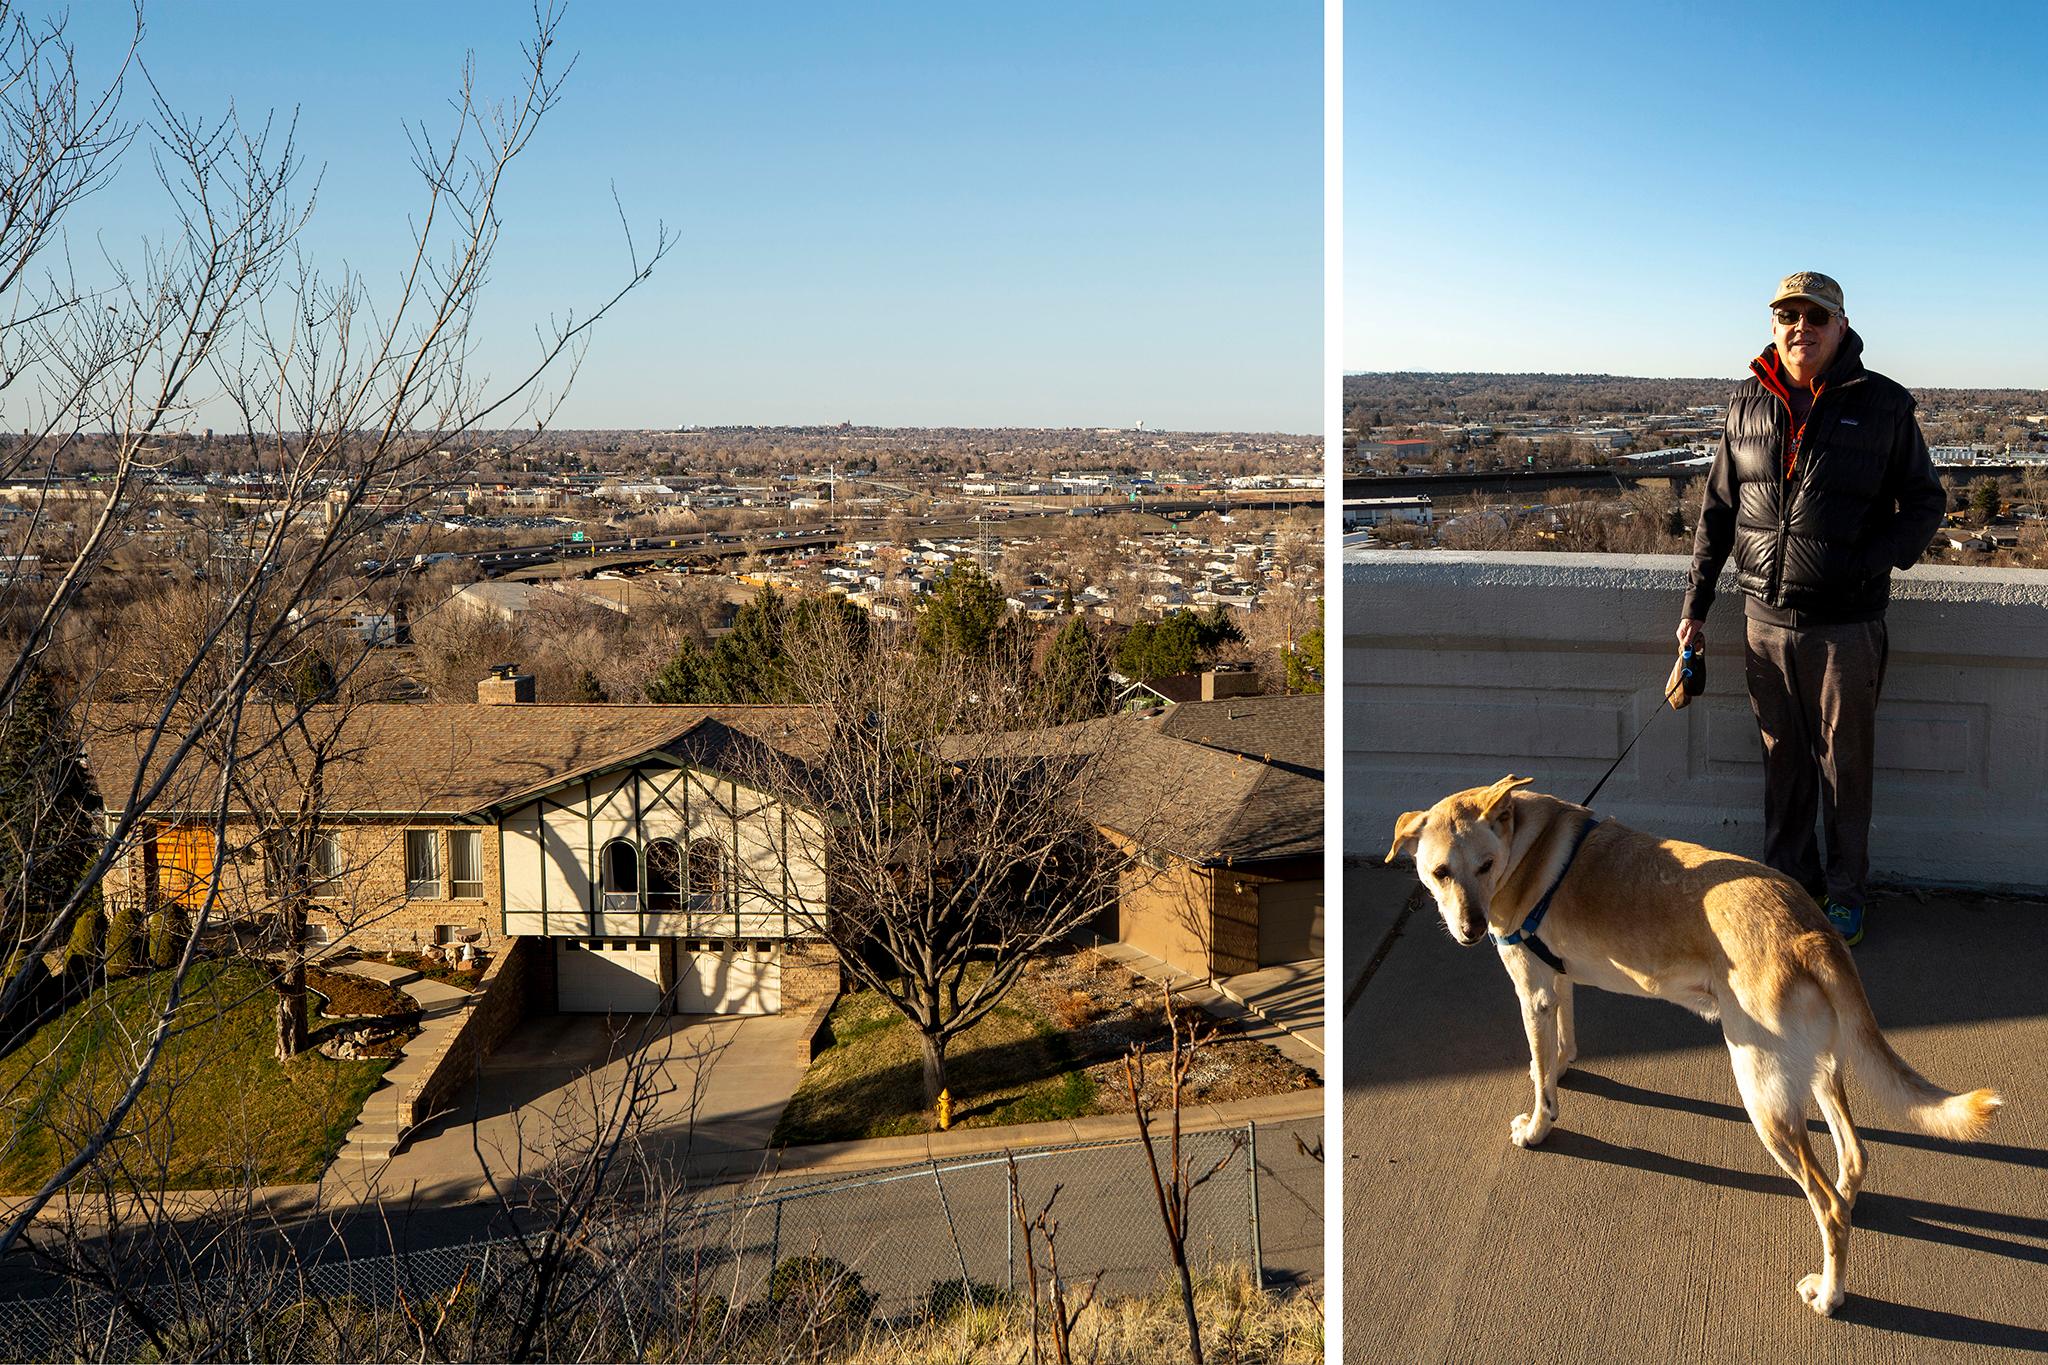
The neighborhood at Inspiration Point still is home to a lot of older folks who've lived there for decades, though young professionals have begun to move in over the last few years. Louise Esquibel, who's lived in the area for 20 years, said it was once a "haven" for cops and city workers who were required to reside in Denver but still wanted to live as far away from downtown as they could. Like a few of her neighbors who spoke with us, Equibel said she'd never heard of environmental concerns in the area.
Up the street, Stan Smith was walking his dog, Cody, and said he'd talk if we could keep up. Plowing up the steep hill, Smith didn't lose any breath as he explained he'd never heard of environmental risk in the area and wasn't so worried about it. It turns out we were speaking to an expert.
"You're talking to a geophysicist, you know," he said as he crested the hill into the park.
Smith spent years identifying geologic hazards for utilities and industrial companies, both near Denver and across the country. He said the work gives him perspective when it comes to industrial pollution, which he knows he's bound to come into contact with. Humans live amid myriad of "risk plumes," he said. Be it a nearby smoke stack, the remnants of Rocky Flats or COVID-19, there's not much of life that is totally free from potential dangers.
"We're all at risk of geologic hazards that most of us ignore, except for maybe floodplains," he said, shrugging.
He's seen plenty of outcroppings of radioactive rocks and chemicals that occur naturally in the soil. He wasn't fazed much by news that he may live near a TRI hotspot.
Ricardo Mendez, whose in-laws live under the plume, said he also wasn't too worried. As a petroleum engineer, he said he's seen his share of hazards. But he has deeper experience with this kind of thing: He grew up in Elyria Swansea, where environmental risk is discussed all of the time.
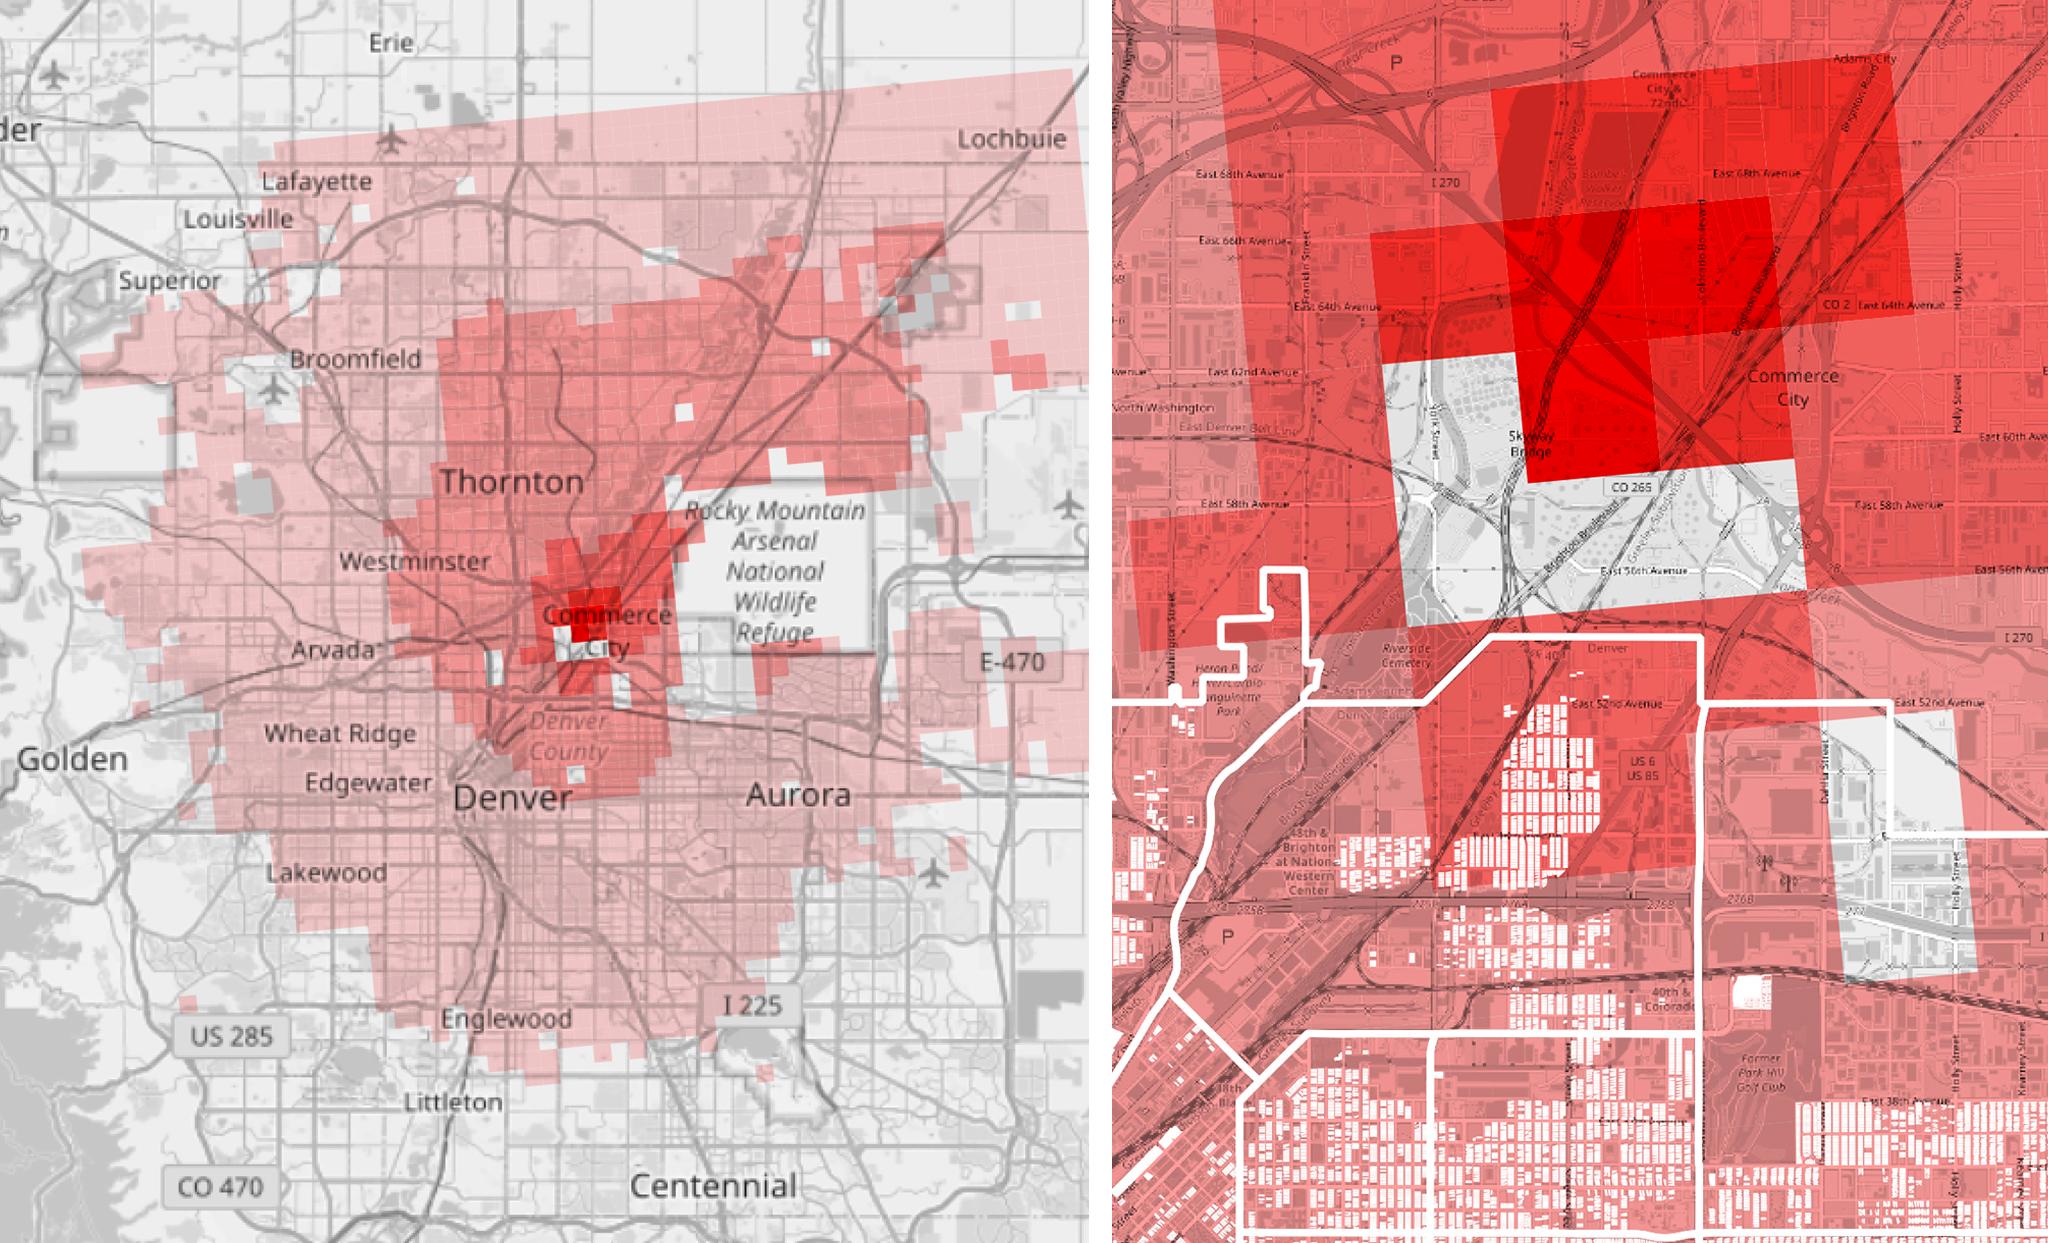
Finally: North Denver and its legacy of environmental activism.
The next two hotspots are very close to north Denver and two neighborhoods that have been loudly fighting industrial pollution for years.
The first hotspot, near I-25 north of Globeville, is primarily caused by a 2019 chromium release from a Wells Concrete plant. The CDC says chromium can increase risks for lung cancer.
The second hotspot belongs to a regular target of environmental activism: Suncor Energy. It's the state's only oil refinery and, with its endless jungle of pipes, flames and smokestacks, it has easily become a symbol of environmental racism that north Denver residents say have plagued their neighborhoods. The facility is super-visible and had been the site of a number of high-profile chemical releases, including one that involved a reverse-911 call to "shelter in place." Still, there are a lot of pollution sources around Globeville and Elyria Swansea, including the intersection of two major highways, so it's nearly impossible for the community to prove that higher asthma rates in the area are a direct result of this one facility.
Impacts from exposure to many different pollution sources is also not super well understood, and environmental rules typically address single chemicals as if they existed in a vacuum. On Thursday, Rep. Diana Degette introduced federal legislation that would attempt to get at this problem, which she says disproportionately harms minority and low-income communities. Globeville and Elyria Swansea are two of 100 communities subject to complex pollution that the measure intendeds to help.

The RSEI data can help peel back layers of pollution and show what's going on in this part of town. The Commerce City hotspot was impacted by 419 releases from 84 facilities. The riskiest chemical was a benzene release from Suncor. Benzene can be fatal if inhaled at a high enough concentration and can cause tremors, dizziness and headaches at lower levels. The chemical is also one that local activists have been concerned about for years - and were disappointed to learn there are no federal standards meant to limit it in ambient air.
Benzene has also been the center of a recent roiling in state politics. Last year, the legislature passed a measure that required the state's largest benzene emitters to beef up air quality monitoring; the threshold for this rule relied on TRI reports, which companies submit themselves and have broad latitude to revise numbers going as far back as 1991. After the bill passed, three of four facilities subject to the new rules revised their benzene projections, dropping them low enough to skirt new monitors.
One of the facilities that revised its numbers was a Sinclair Oil terminal, which is responsible for the fifth hotspot on our map, the dot on the northwest corner of the Rocky Mountain Arsenal.
In recent weeks, whistleblowers made accusations that state regulators encouraged companies to falsify data so their pollution permits could be quickly approved. Activists have reacted with vitriol.
Rebecca Curry, a policy expert with EarthJustice Colorado, is one advocate pushing for a handful of solutions to this issue right now in the legislature. She and her colleagues want to see more real-time "fence line" monitoring that will provide communities with better information about toxics seeping out of facilities. She also thinks it will help force companies to submit realistic reports to the EPA.
Suncor, she said, was the only company that didn't downsize their benzene numbers. The reason why, she figures: The company is already required to monitor itself at its fence line.
"They were the one facility to not revise their data, and in my mind it's, like, they couldn't because they had this other system," she said.
But the scuffle over benzene numbers highlights a major limitation in these maps and the TRI system as a whole. The numbers do not reflect real-time monitoring, but instead emission estimates that companies themselves report and have the power to revise. Curry said data derived from the system, like these maps, have value, but we should take it all in with the knowledge that the EPA's figures might also obscure the full impact of industrial sites around the city and the state.
Shoutout to ProPublica for inspiring us on this story.