When Denver was young, the area surrounding Santa Fe Drive became the gateway to the city. Close to rail lines, it was the natural place for immigrants and settlers to land as they moved west. Today, we call that area the La Alma/Lincoln Park neighborhood.
The neighborhood's demographics shifted as the city grew, and by the 1970s it was home to mostly working-class and Latino families who were subjected to the era's racist housing and banking schemes. Without the financial backing of banks, there weren't ways to fix old houses, build new businesses or bring in much-needed cash.
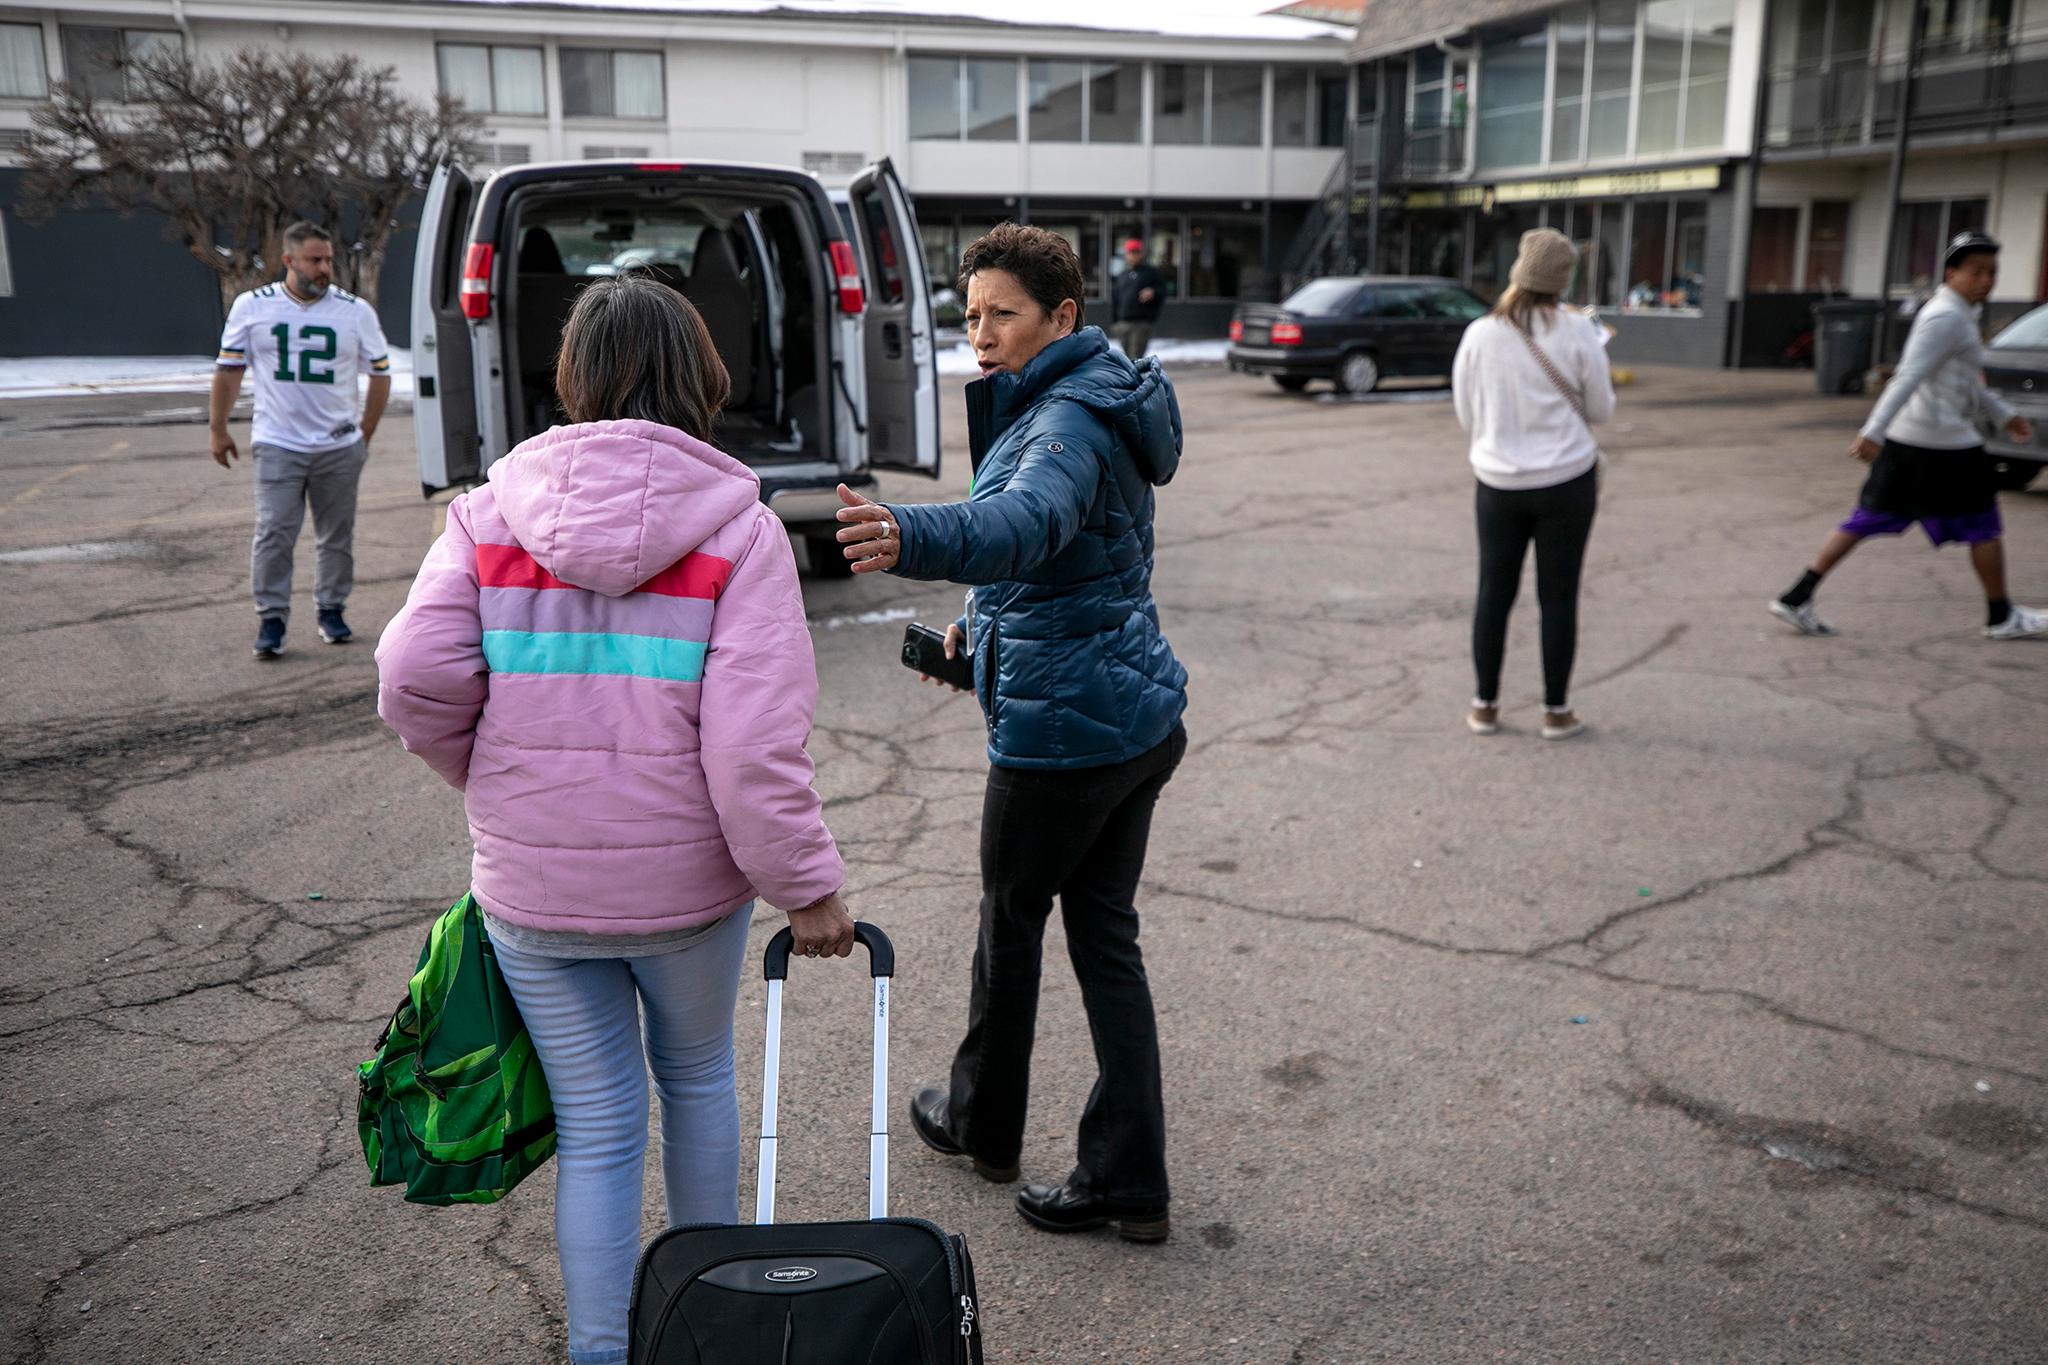
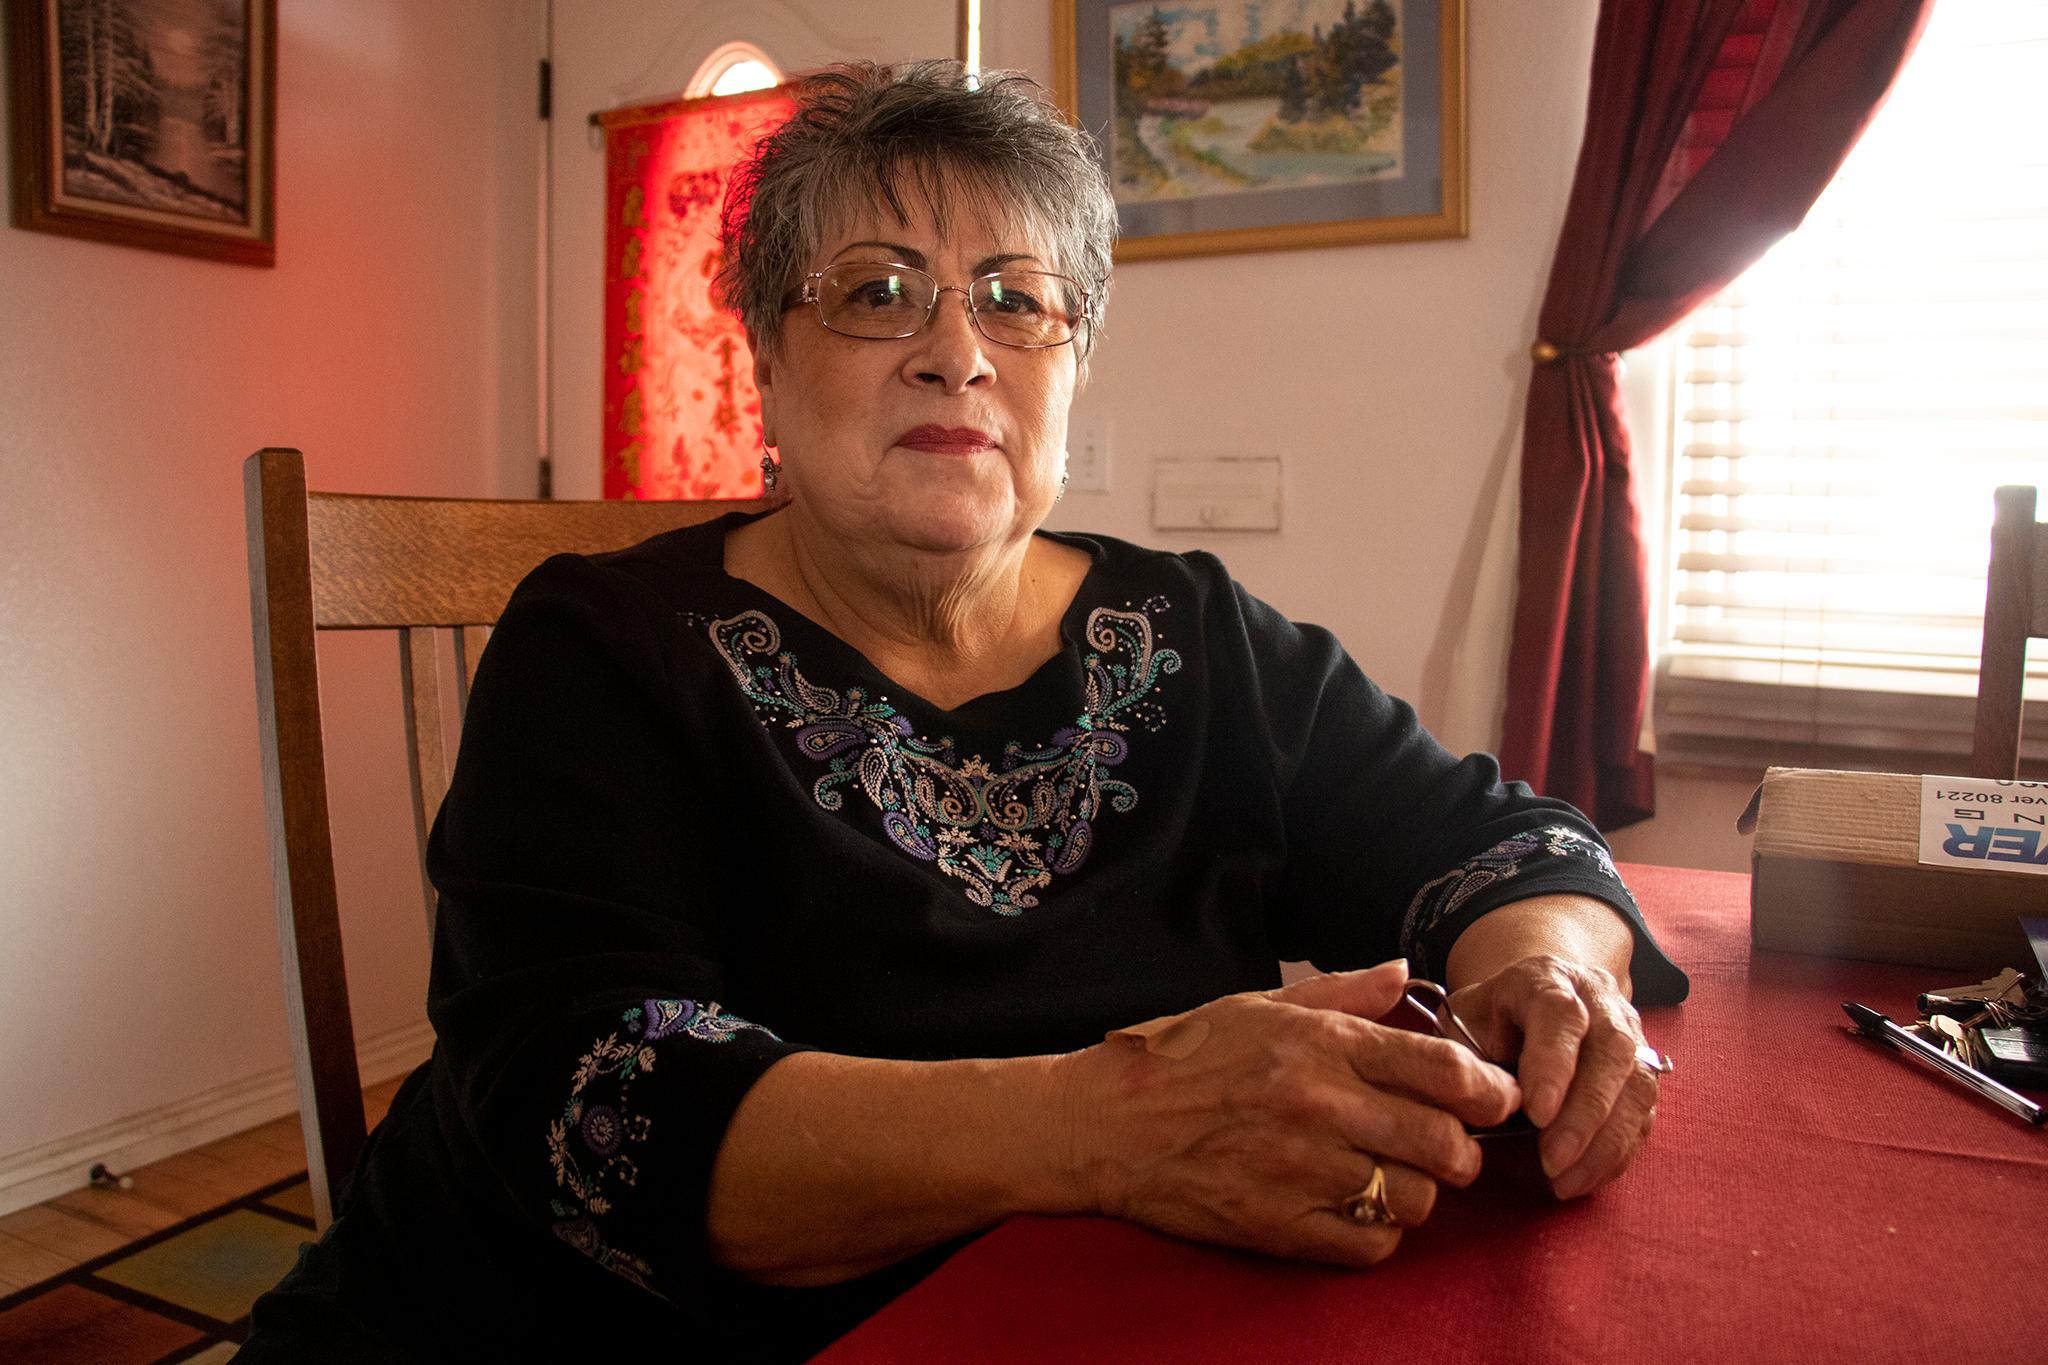
"I would call banks, and they would say, 'Well we don't lend to that community,'" Veronica Barela, who spent decades working to improve the area, remembered. "We were surrounded by redlining. No access to be able to go into home ownership. No access to be able to buy assets, to buy vehicles and stuff like that. And it was difficult."
Denver Public Library/Western History Collection
Until the '70s, areas like La Alma/Lincoln Park were carved out by ethnic and class groups. Their residents gave them names and imbued them with culture, but neighborhoods as we know them today didn't officially exist. That changed in 1973, when the city unveiled official "statistical neighborhoods." The reason why they were created: to map "blight," or conditions the city considered subpar.
Once planners mapped things like education, poverty and crime rates on a citywide level for the first time in Denver's history, they ushered in physical improvements at a time when some homes still lacked running water. But they were also unknowingly mapping the way discriminatory policies shaped the city -- and perpetuating some of those inequities.
The story of how Denver got its neighborhood shapes begins in 1959.
One hundred years after white settlers first arrived at the confluence of the Cherry Creek and South Platte River, officials in Denver were trying to figure out what to do about overcrowding, poverty and crumbling infrastructure left over from the frontier days.
There was a lot of ground to cover and not much of a blueprint to approach such problems. In the early 20th century, local governments mostly dealt with these kinds of issues on a block-by-block basis. They razed old buildings and built new ones without much consideration for how they were impacting the city overall.
But new technology was poised to revolutionize their work. As computers began to appear in American society, and as researchers began to figure out how to plot economic conditions on a map, there was a growing sense that humanity could outsmart social problems that plagued urban areas. Then the Housing Act of 1959 established Community Renewal Programs. CRPs gave money to local governments so they could fund studies that plotted economic conditions. For the first time, local officials had the funds and tools to analyze their cities as a whole.
Denver Public Library/Western History Collection/X-29032
Our statistical neighborhoods finally arrived in 1973.
Dennis Siglinger began working for the City and County of Denver in 1970. He was a data guy with a new master's degree in urban geography from the University of Denver, and he'd soon have the chance to build something with his expertise.
Denver won a federal CRP grant six years before Siglinger arrived, and officials used the money in a failed attempt to parcel the city into shapes. That study, which began in 1964, sought to divvy the city up into "residential" and "nonresidential" areas, but Denver was changing so fast that those lines were quickly blurred.
In 1970, Denver received a new CRP grant to try again, and Siglinger and his colleagues began a different approach. Instead of drawing arbitrary lines, they lumped existing Census tracts together to create 73 official statistical neighborhoods. Each area came stocked with federal Census data. These official neighborhoods were given names, often based on well-known features in them, such as Union Station, or colloquial terms already used to identify certain areas. Many of the identified 73 neighborhoods still exist, maintaining shapes and names forged fifty years ago.
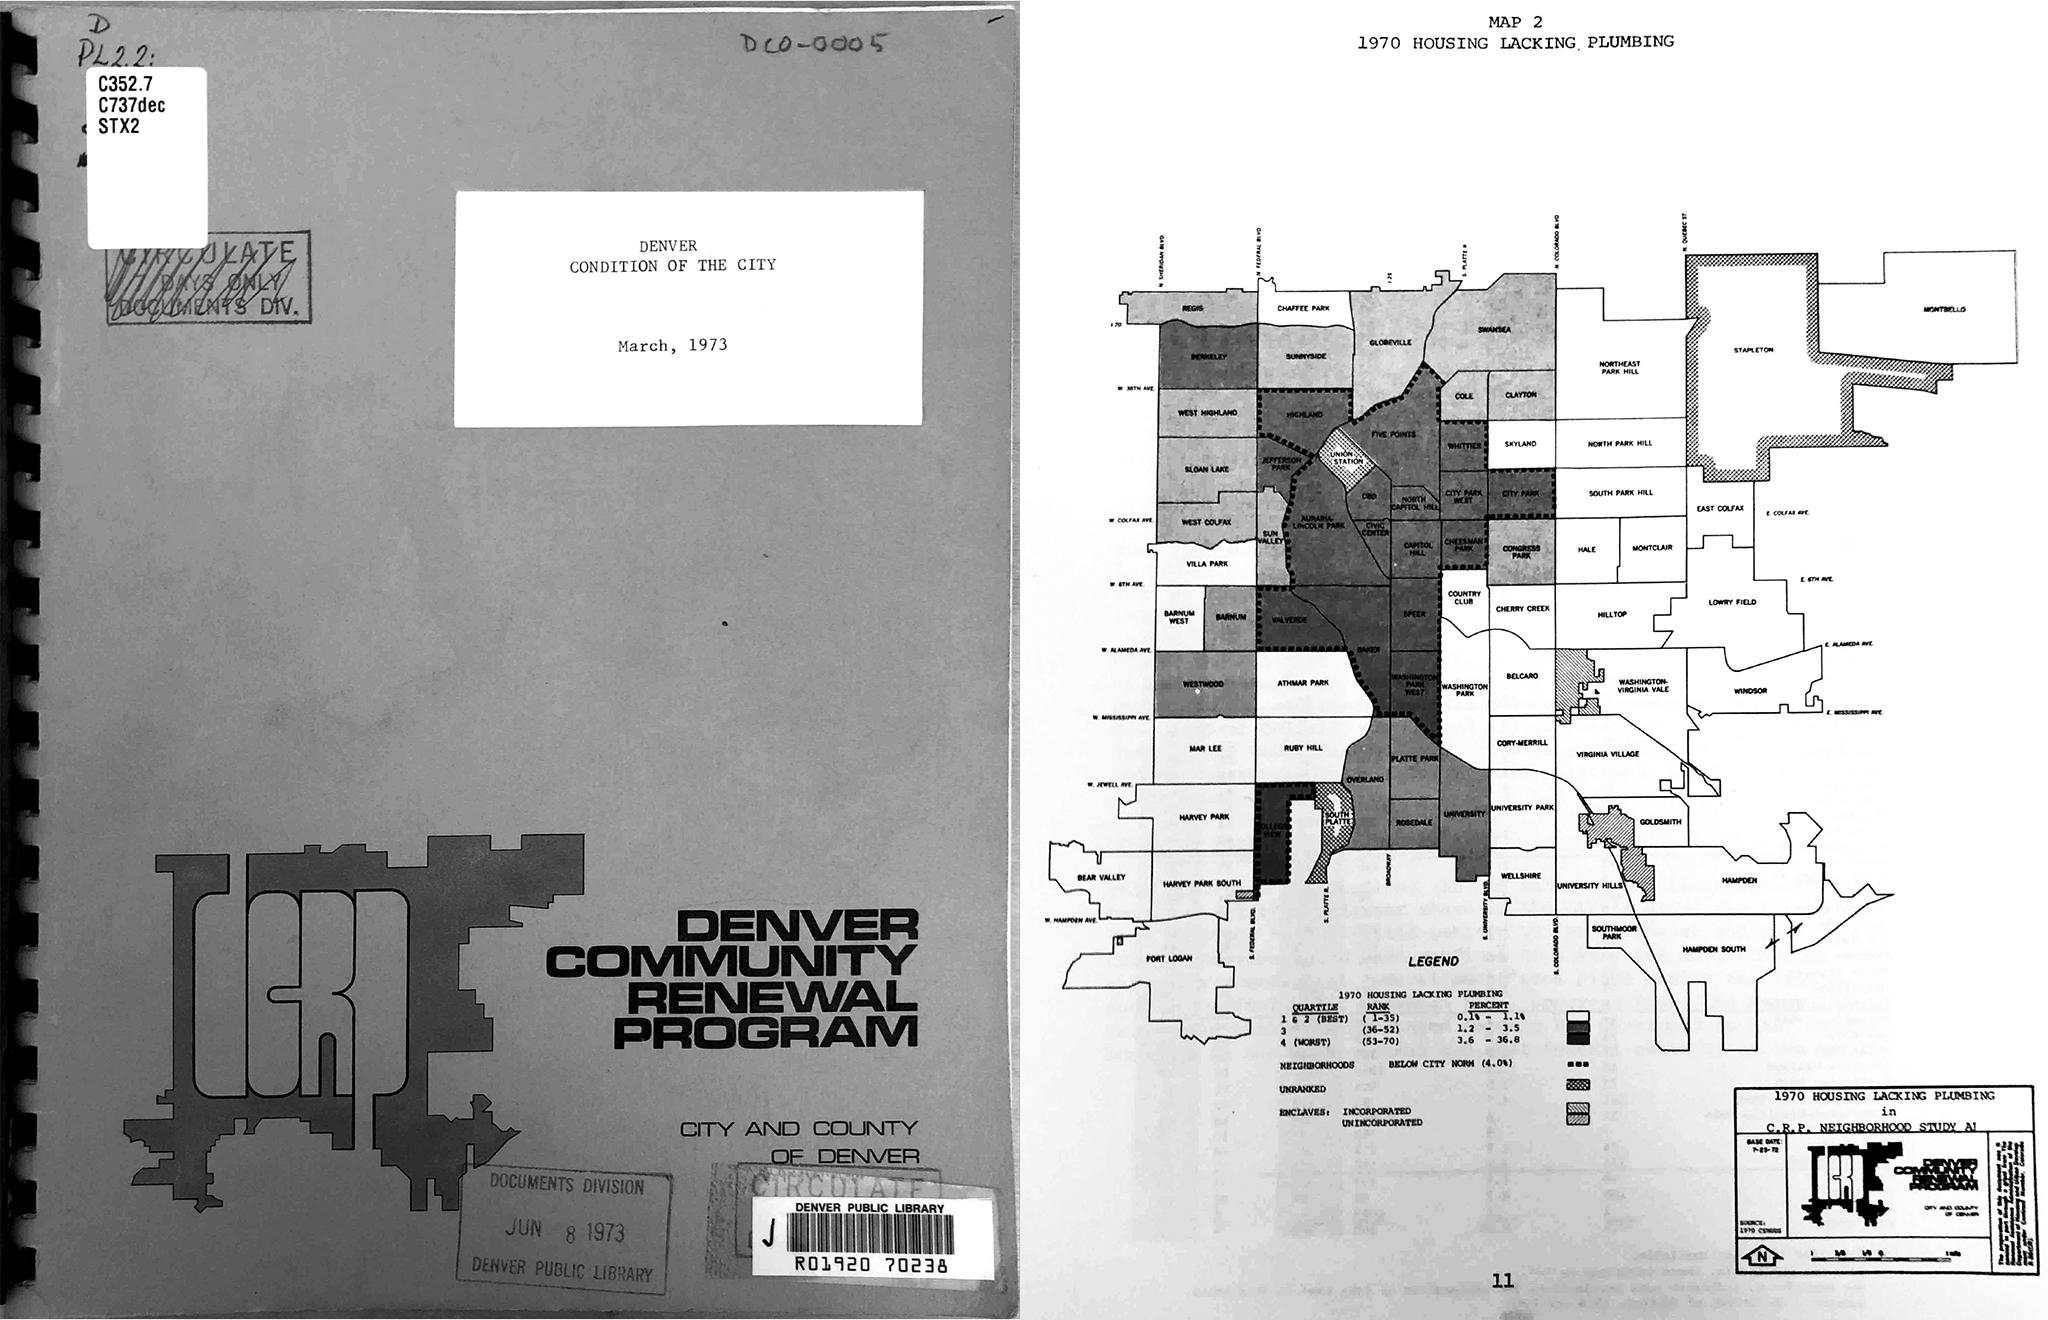
Denver's planning office spent years on the project. Finally, in 1973, it released its findings in a report called the "Condition of the City."
"It was a baseline study that had not been done to that extent ever before and, as far as I know, no such study has ever been undertaken again," Siglinger said.
He was excited to be a part of the effort: "It was kind of like my baby for quite a long time."
Denver Public Library/Western History Collection
The report's opening paragraphs explained why Denver needed to create official neighborhood boundaries in the first place.
"One purpose of the Community Renewal Program has been to identify and analyze the location, extent and severity of blight (or the need for renewal) in Denver," it reads.
"Renewal," the report went on, was specifically related to making Denver "an attractive place to live and work."
Looking back, Siglinger said there was another reason why Denver and other cities pursued these kind of projects in the '60s and '70s.
"It was kind of a response to all the civil unrest we were experiencing during the war, the Vietnam War," he said.
As the public soured on America's foreign policy, officials needed wins at home.
"The federal government was providing these grants to study problems and then come up with programs to fix them," Siglinger said.
Siglinger and his team then began to fill in each neighborhood with statistics collected by the U.S. Census Bureau and the Denver police and health departments.
Whether they knew it or not, this was the first time officials mapped inequality across the city and their efforts would perpetuate inequality that exists today.
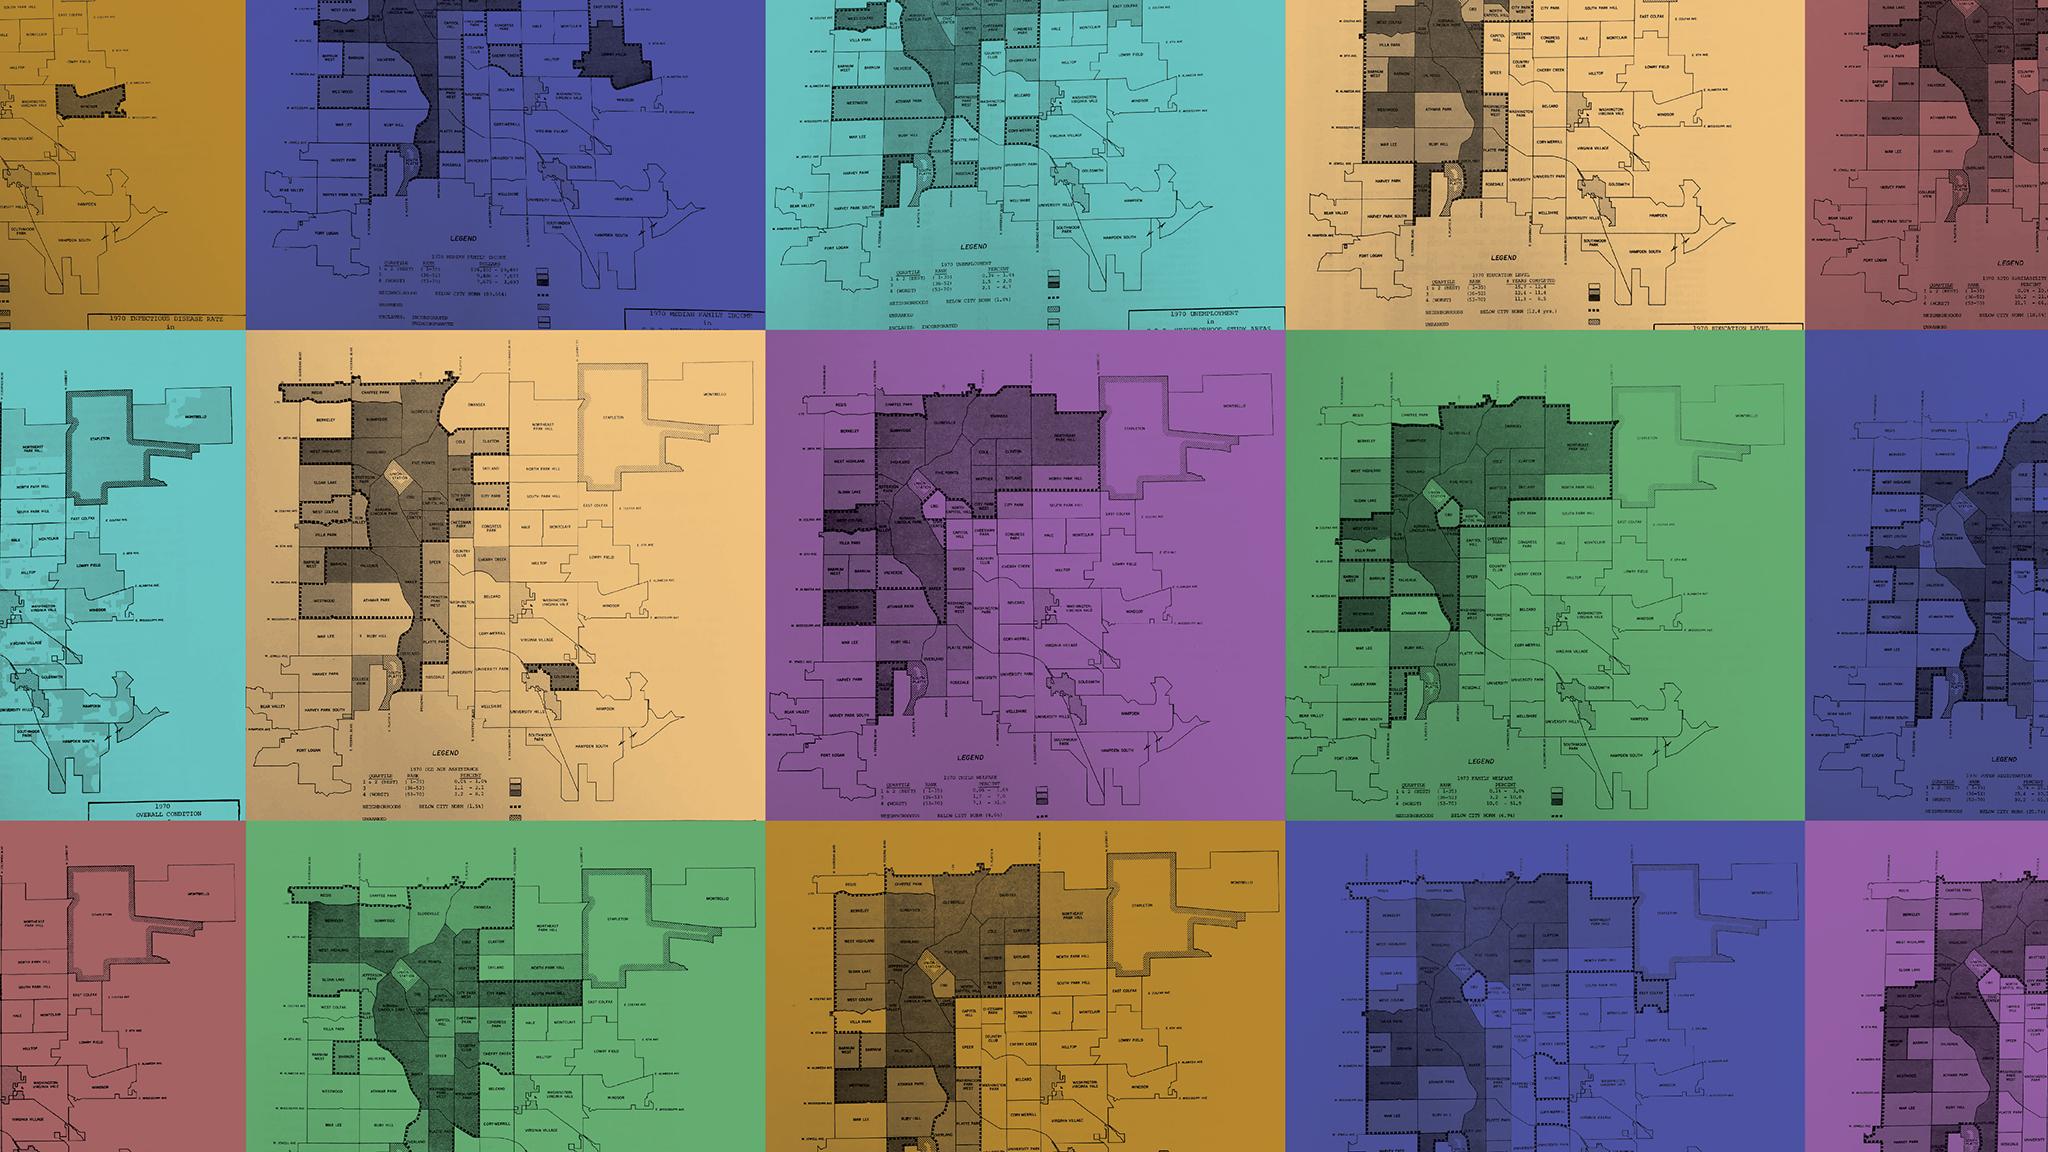
"Conditions of the City" mapped the built environment, identifying for example the oldest homes and those that lacked indoor plumbing. It mapped economic statistics, like housing values, unemployment rates and the number of families that relied on welfare, and certain social factors, like crime rates and the prevalence of infectious diseases.
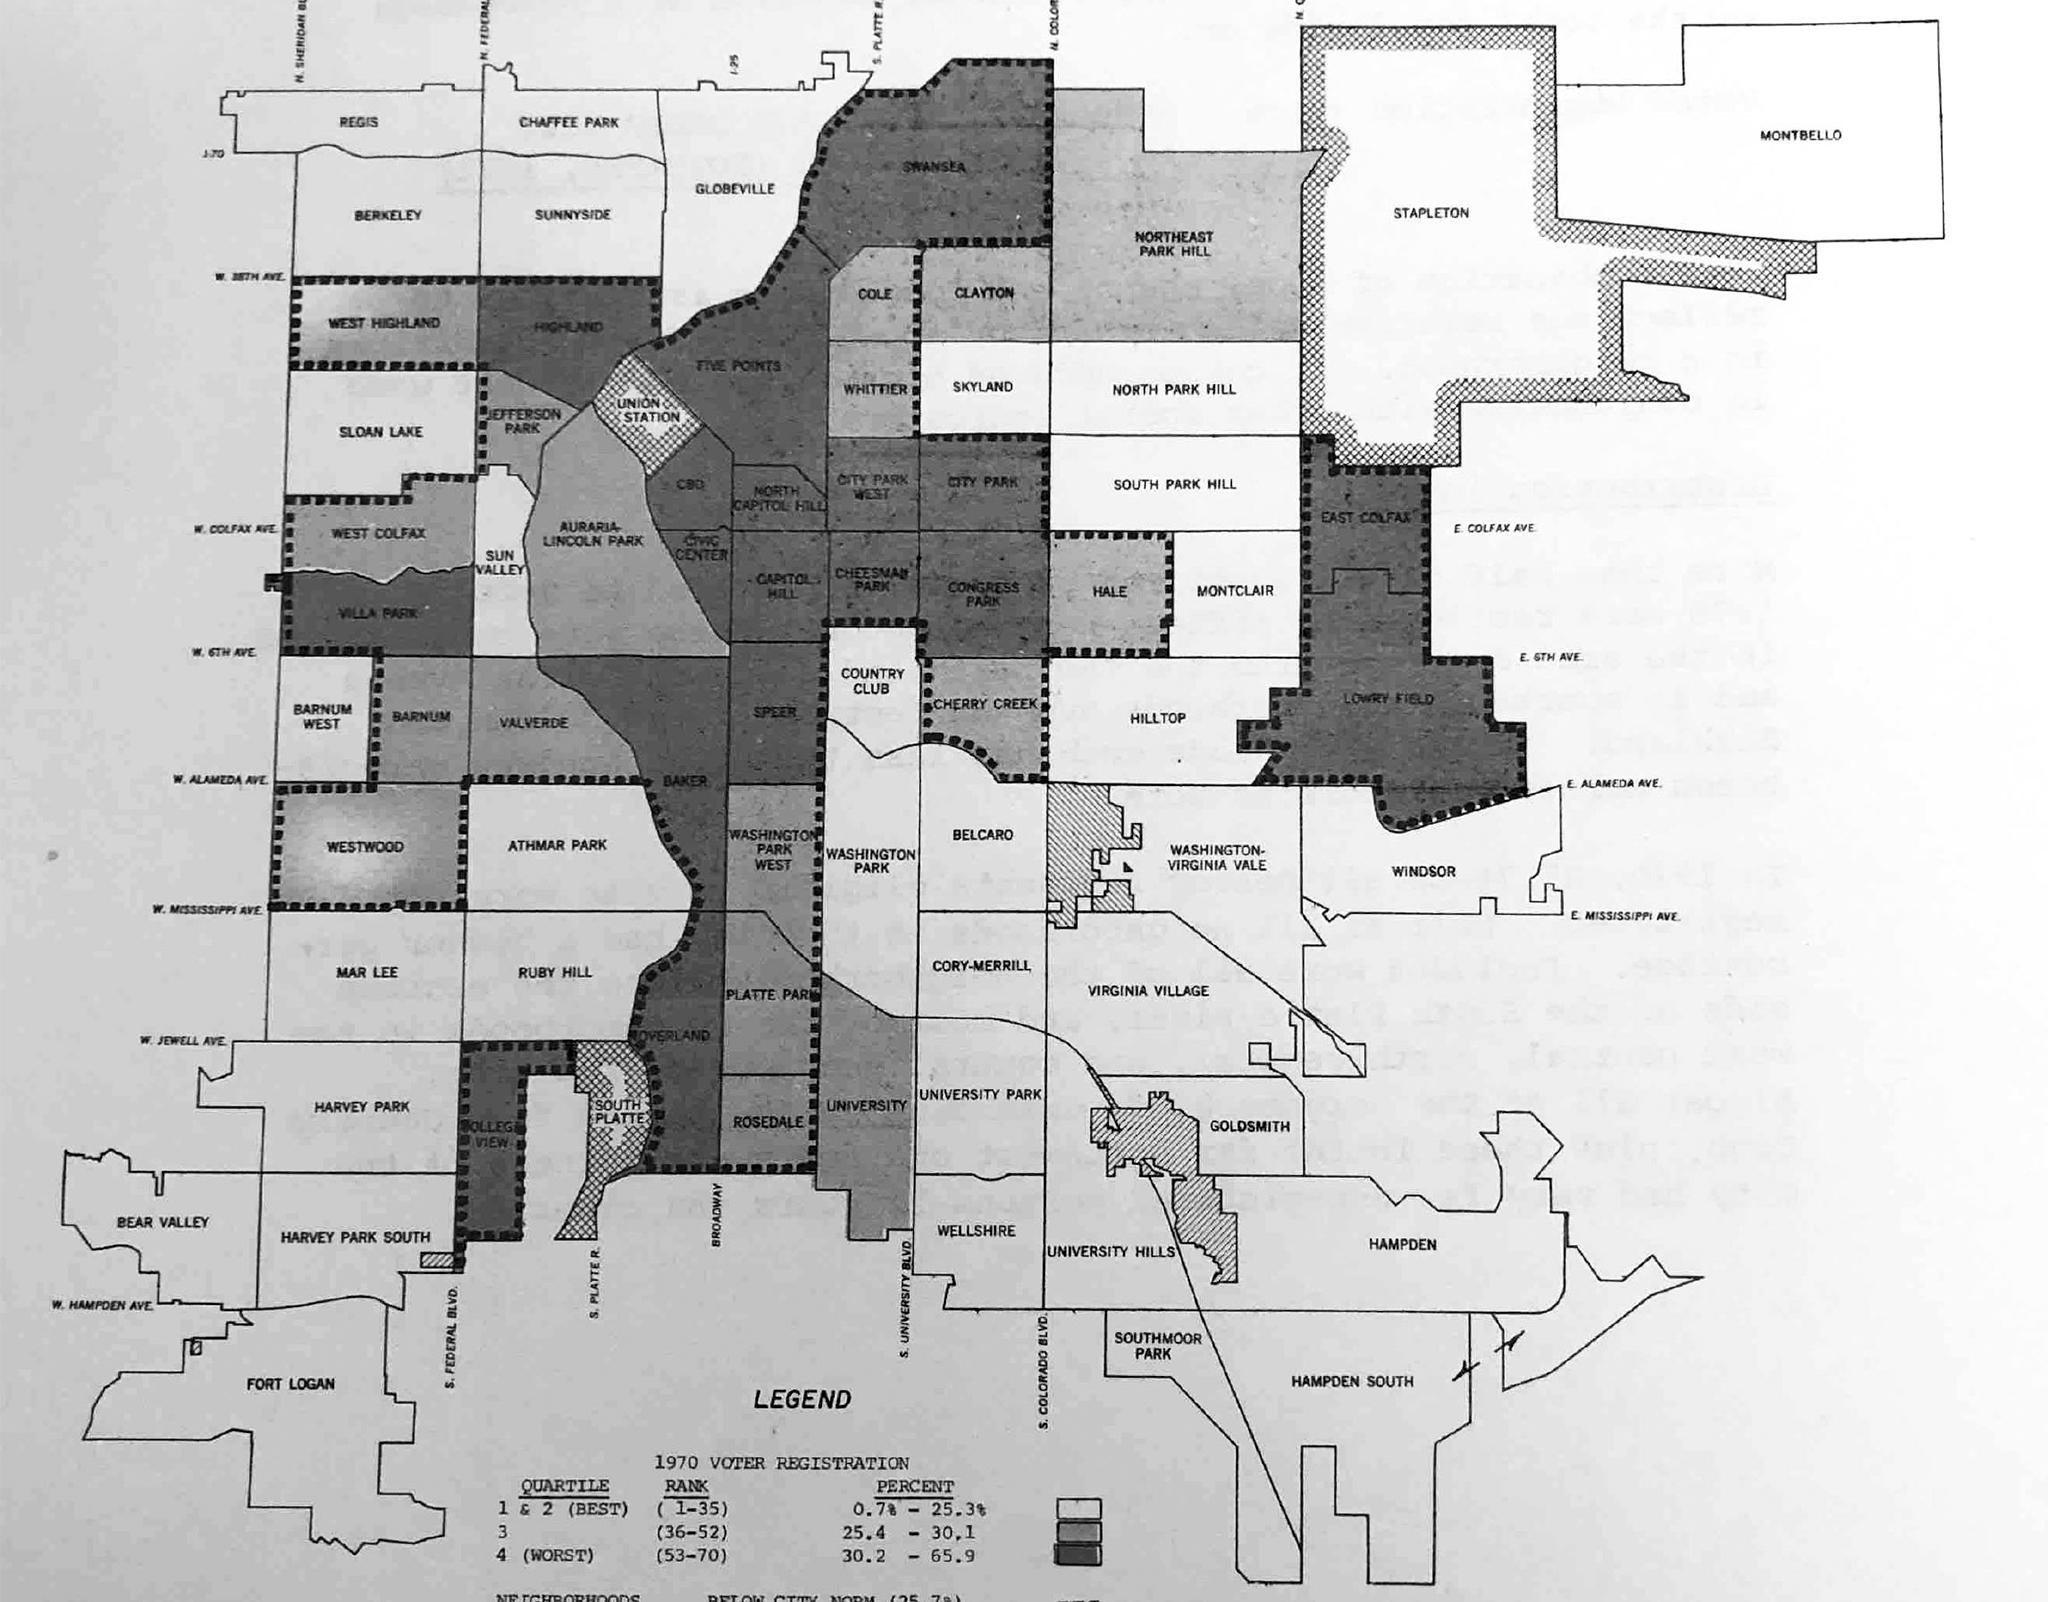
But some of the statistics -- 15 in all -- weren't as clear cut. One map showed where people were more likely to be registered to vote, which planners wrote showed the "extent of apathy" residents had toward neighborhood conditions. Five Points -- home to many Black residents, who were disenfranchised to begin with -- received low grades in this category.
Denver Public Library/Western History Collection
A handful of neighborhoods appeared at the bottom of the rankings again and again, spelling out for officials which parts of town were thought to be in the worst shape and needed the most focus or investment. Veronica Barela's neighborhood, La Alma/Lincoln Park - which at that time was lumped together with Auraria into a single tract - was among them. Planners considered La Alma/Lincoln Park overcrowded, but in reality it was the longtime home of immigrants who often shared housing.
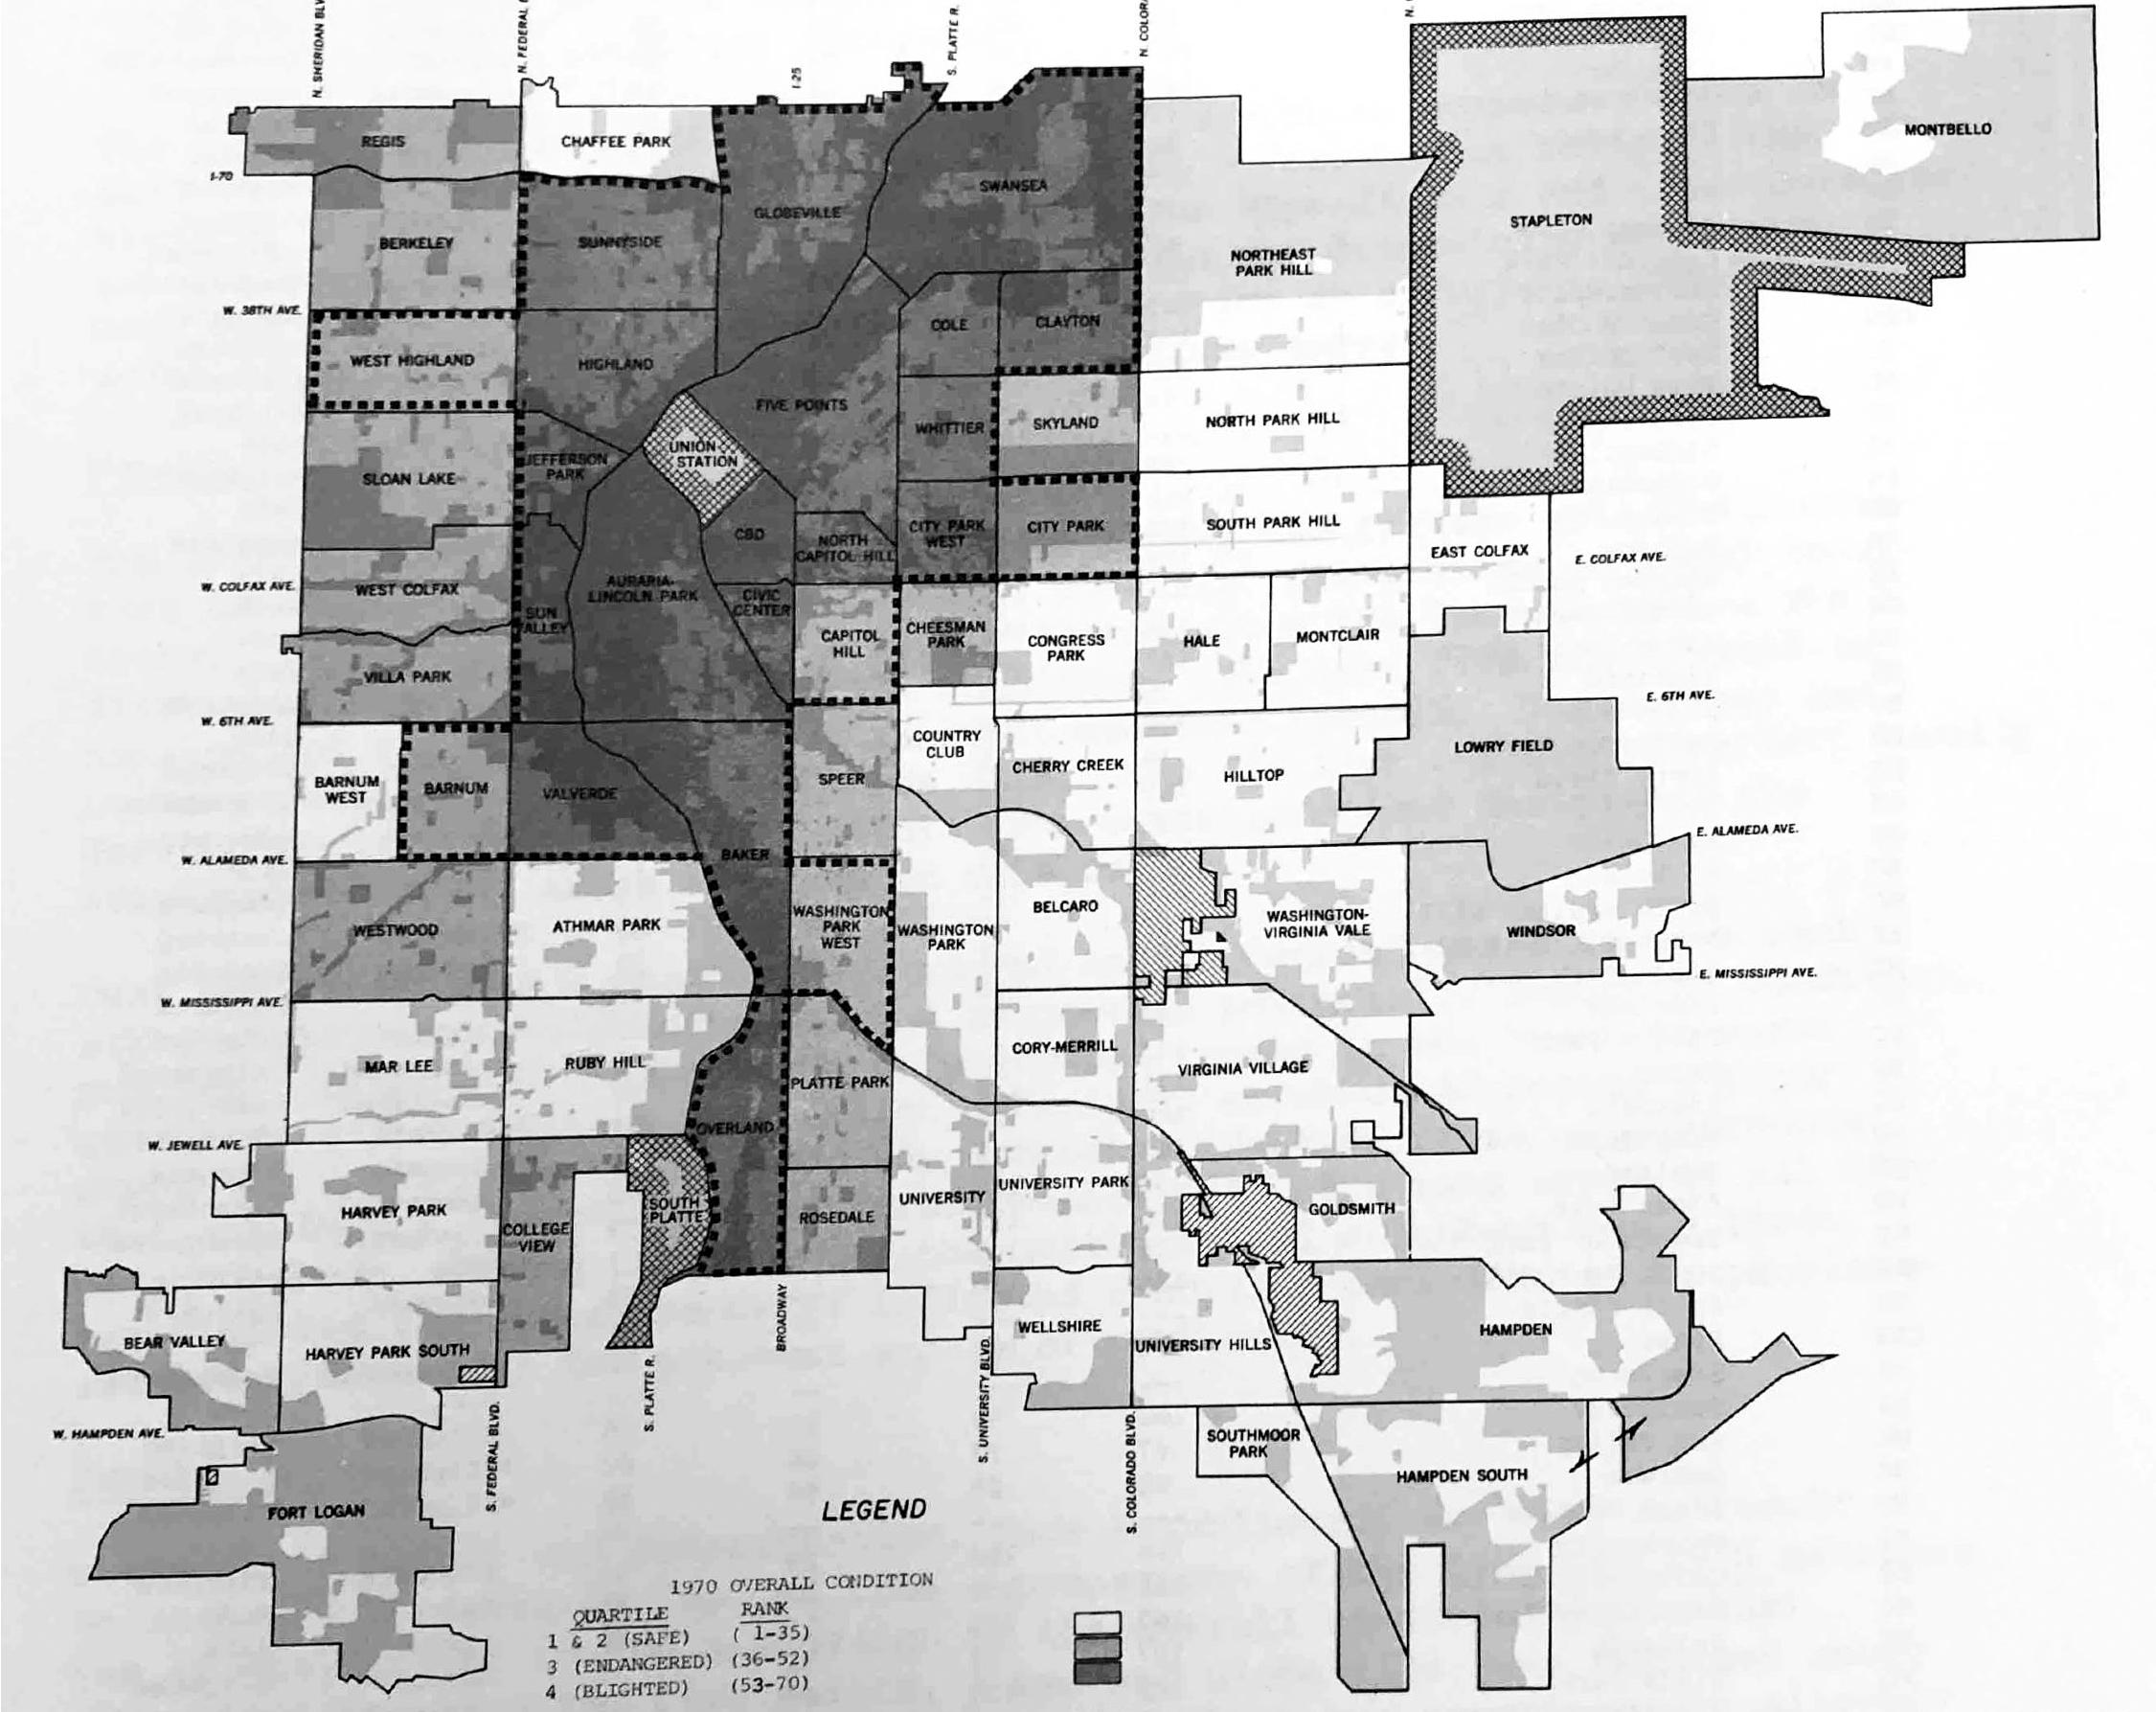
The maps in "Condition of the City" ultimately presented the "overall condition" of the city's neighborhoods. To determine if areas were "safe," "endangered" or "blighted," they created a single index value from nine of the 15 statistics: houses without plumbing, houses built before 1940, rent prices, housing values, overcrowding, median family income, residents' access to a car and education, and unemployment levels.
John Elrick, a University of California, Berkeley doctoral candidate who researched Community Renewal Programs for his dissertation, said this era in urban planning began with good intentions but perpetuated long-lasting inequalities in cities across the country. Because places like Denver considered social factors as well as infrastructure in urban planning, places were destroyed for the wrong reasons. For example, things like education and employment levels -- or, rather, unequal access to education and unemployment -- became reasons to bulldoze communities.
"This attempt at governance takes race, especially, as a kind of valuation. It reinforces the idea that race and people of color - low income people of color - are problems," he said. "And then political decisions get made: What to do with those political problems?"
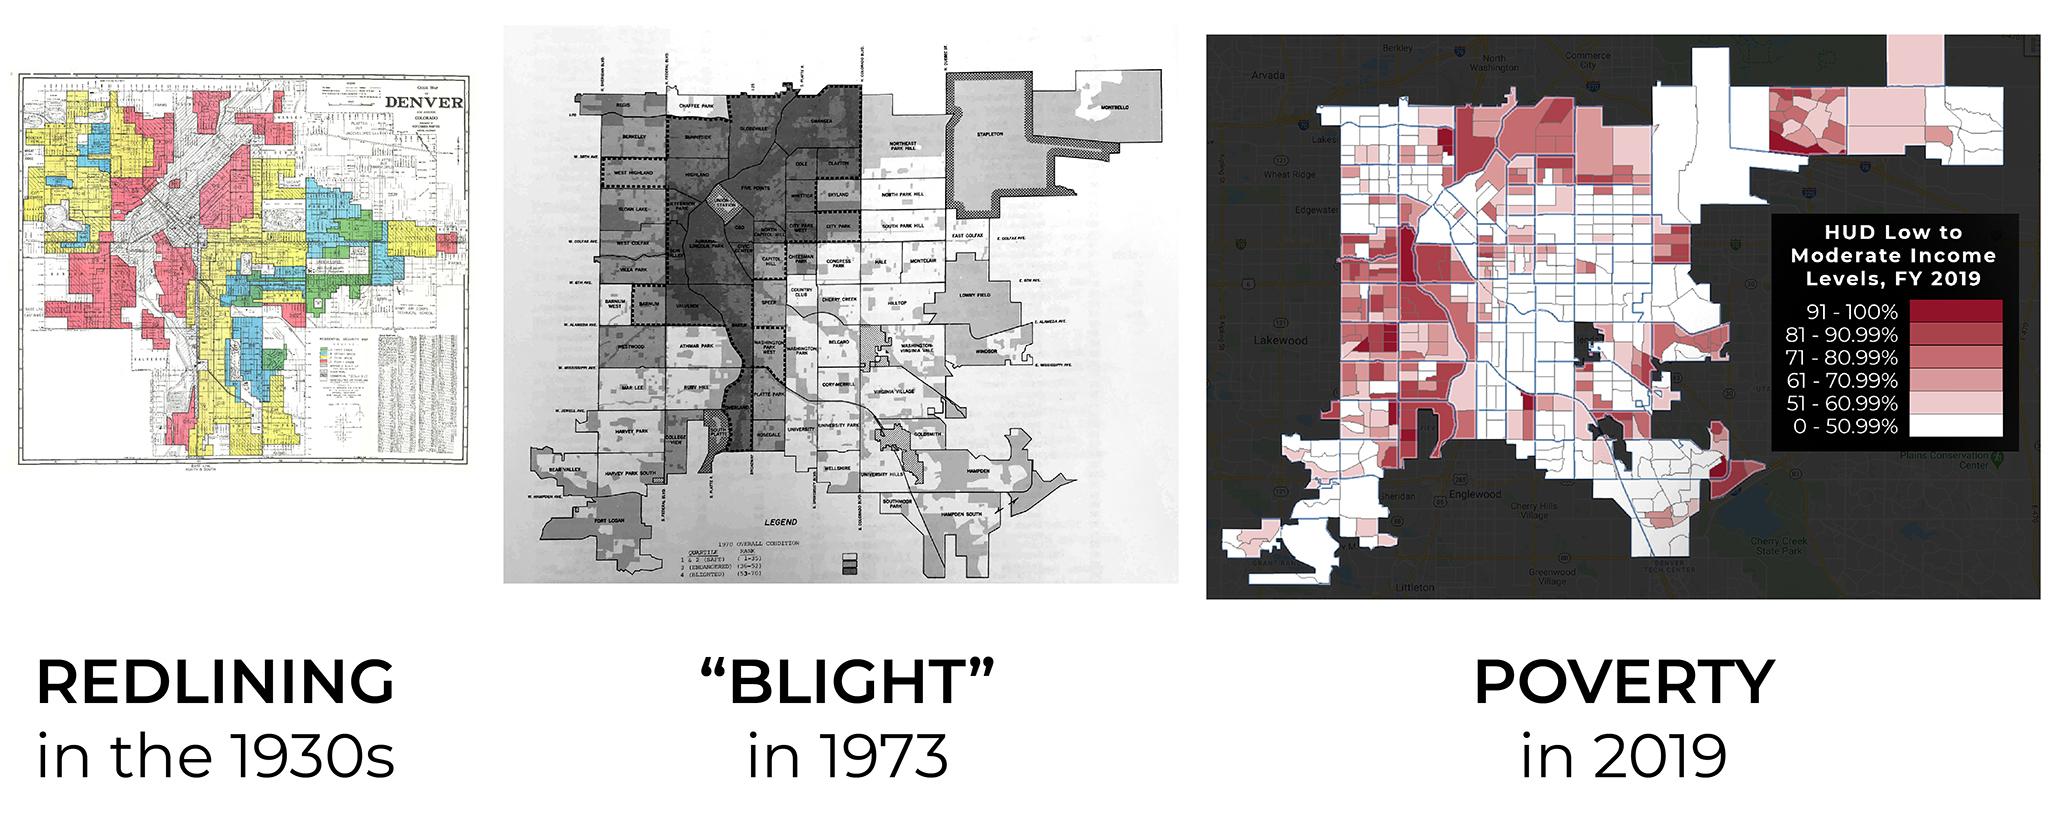
In the early 1900s, marginalized groups were barred - or "redlined" - from moving into certain areas and from getting certain loans. When urban planners started mapping in the '60s and '70s, their results inevitably reflected these racist practices.
Sources: Richmond.edu, Denver Public Library/Western History Collection and Denver Open Data
Siglinger said things like segregation never came up during his mapping project so many years ago.
"Someone back in Washington, D.C., or someplace, may have been thinking about that and drawing the connection. But as far as me and the staff that we had, working on putting up the social, economic and housing indicators, we had no connection to redlining studies or anything," he said. "I don't think I ever heard of the words 'redlining' until years later. Maybe I was naïve about it, but I wasn't even aware of it."
Areas in Denver marked "blighted" in the '70s had been redlined in the 1930s. Those areas also stick out in contemporary maps that show neighborhoods with lower education levels, fewer trees and the highest risks for gentrification; we call this pattern the "inverted L."
Denver's early blight studies transformed the city, for better or for worse.
La Alma/Licoln Park and Auraria earned the lowest possible ranking in 14 of the city's 15 indicators used in "Condition of the City." Residents were more likely to need welfare assistance, live in a home without plumbing, and catch an infectious disease. They were less likely to be educated or earn more than the city's median income. Their neighborhood was deemed "blighted."
Veronica Barela said that over her life she had seen the neighborhood fall into disrepair.
"Santa Fe had just taken a nose dive," she recalled. "We lost a grocery store, we lost a JCPenney, Zales and two drug stores."
In 1977, Barela became the president and CEO of Newsed, a federal Community Development Corporation (or CDC) that sought to rebuild infrastructure on Denver's west side. Like Community Renewal Programs, CDCs were part of the national "urban renewal" movement and received federal money to solve blight in American cities.
With Barela at the helm, Newsed repainted homes, built two new strip malls, and shepherded in a new grocery store, the King Soopers at 13th Avenue and Speer Boulevard. The organization ultimately helped inject life back into Santa Fe Drive.
"What we got out of it was a facelift for the whole community," she said.
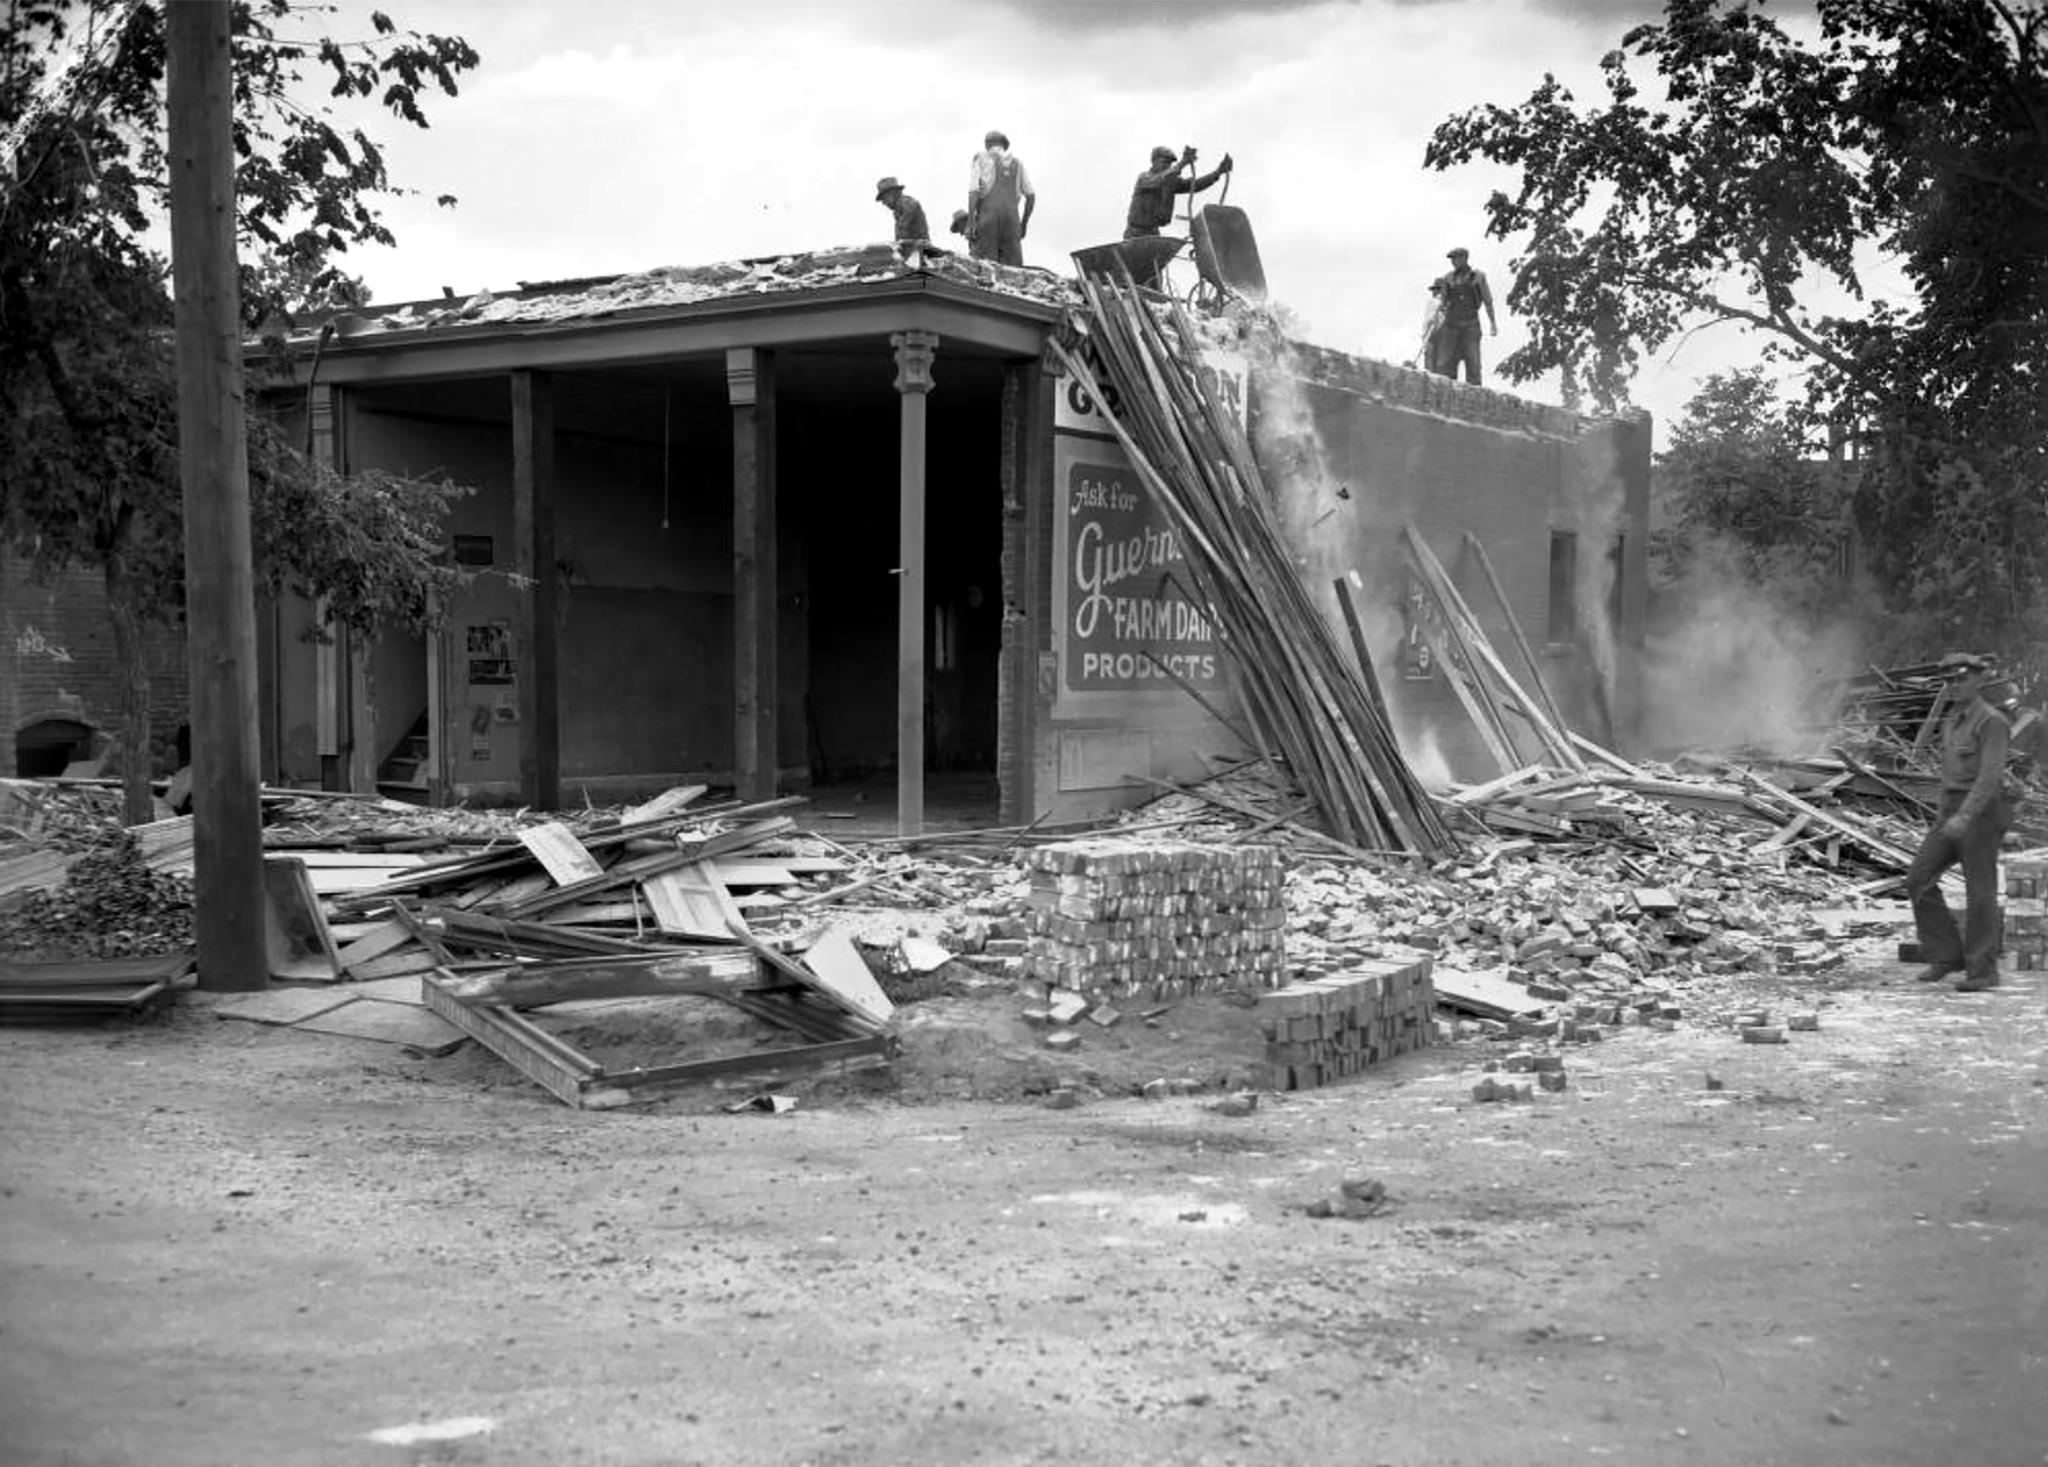
But Auraria became a case study in the ways that urban renewal could also destroy a community.
In the late '60s, state officials chose the site for a future higher education campus. Though Denver had yet to begin its neighborhood study, city officials already viewed the area as blighted.
"Once a thriving, largely Hispanic community, Auraria had been rezoned for industrial development decades earlier, and the result was a neighborhood in decline -- shrinking in numbers and being overtaken by commercial and industrial uses," reads a report celebrating the 50th anniversary of the Denver Urban Renewal Authority, or DURA, one of two organizations the city created to deal with blight. "Moreover, the site's proximity to downtown and the existing facilities of CU Denver and Metro State made it a very attractive location for the combined campus operations."
For people who lived in Auraria, the project was a looming calamity and galvanized westsiders to fight the new development. Community newspapers at the time considered "urban renewal" and "DURA" slurs.
"The majority of building activity is in the downtown area for office buildings and banks, high rises and 'elegant' shops," a columnist wrote in a 1971 issue of the Chinook, a counterculture newspaper. "Has anyone approached you or your neighbors to ask what you think your community needs? Do you even feel that you live in a community, not just a building?"
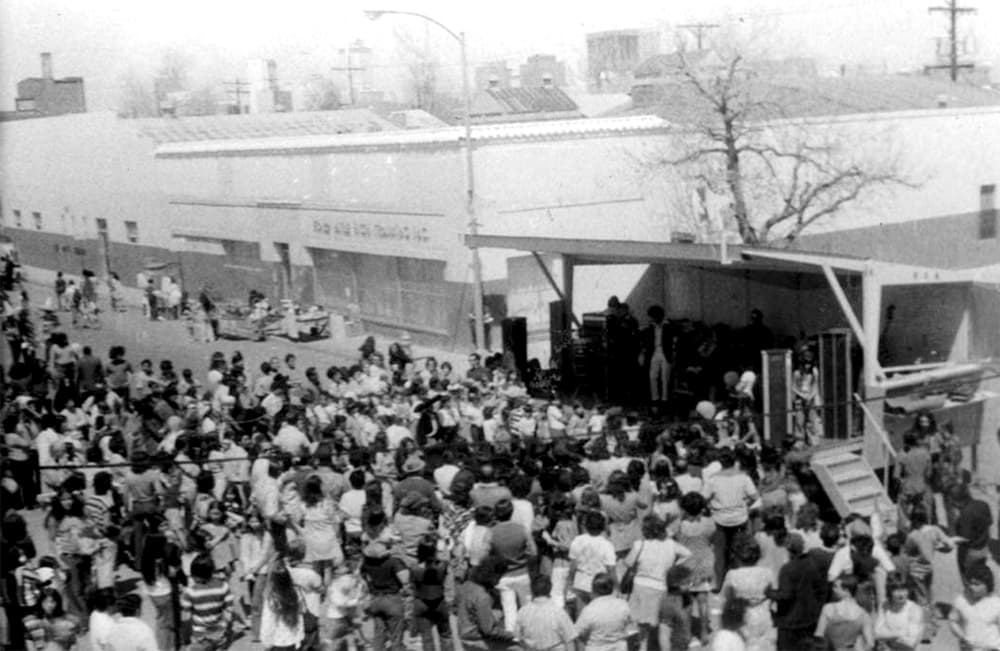
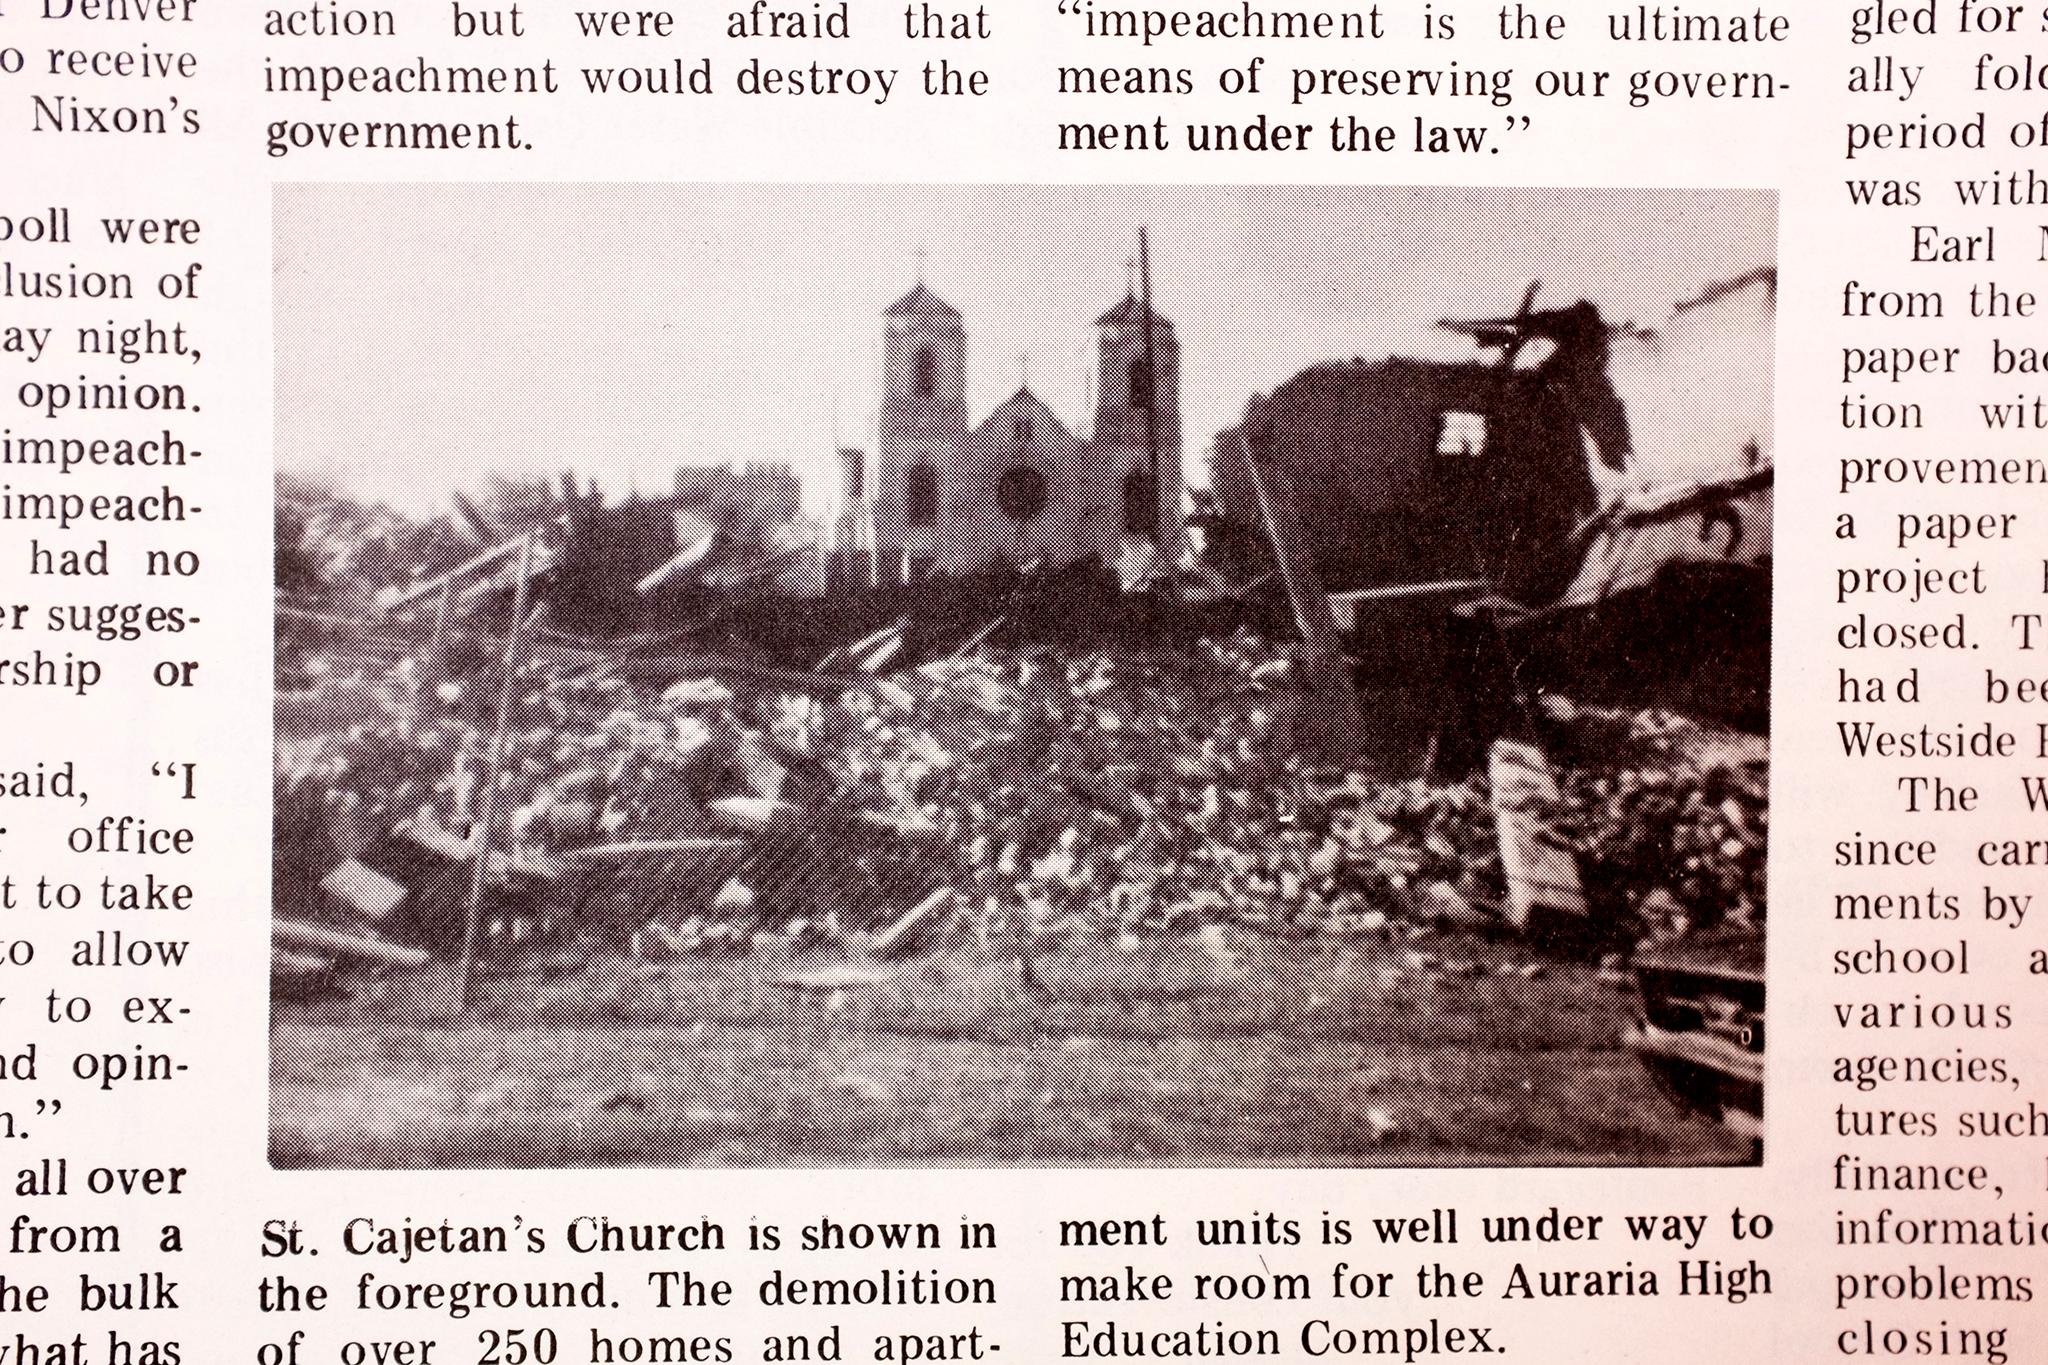
The struggle helped Santa Fe Drive become a major hub in the national Chicano movement, but -- despite fierce protest -- Auraria's homes were scraped in 1973, the year "Condition of the City" was released.
DURA's executive director, Tracy Huggins, told us the war on blight has changed over time. Decades ago, DURA's sole mandate was to raise property values. Since then, she said, it's learned to think about quality of life for everyone. Still, its work is tricky.
"Of course, we are structured to help affect change in challenged areas," she said. "Sometimes, change can have those unintended consequences that we were not looking to address. And even as you recognize some of these unintended consequences, how do you really keep them from happening again?"
America's craze over mapping, planning and funding blight out of existence in the '60s and '70s resulted in a "mixed bag" for people who lived in the worst-ranked areas, Historic Denver executive director Annie Levinsky told us. On one hand, groups like Newsed were able to improve neighborhoods whose residents were subjected to racist policies. On the other hand, communities in "blighted" places like Auraria were forcibly removed in the name of progress.
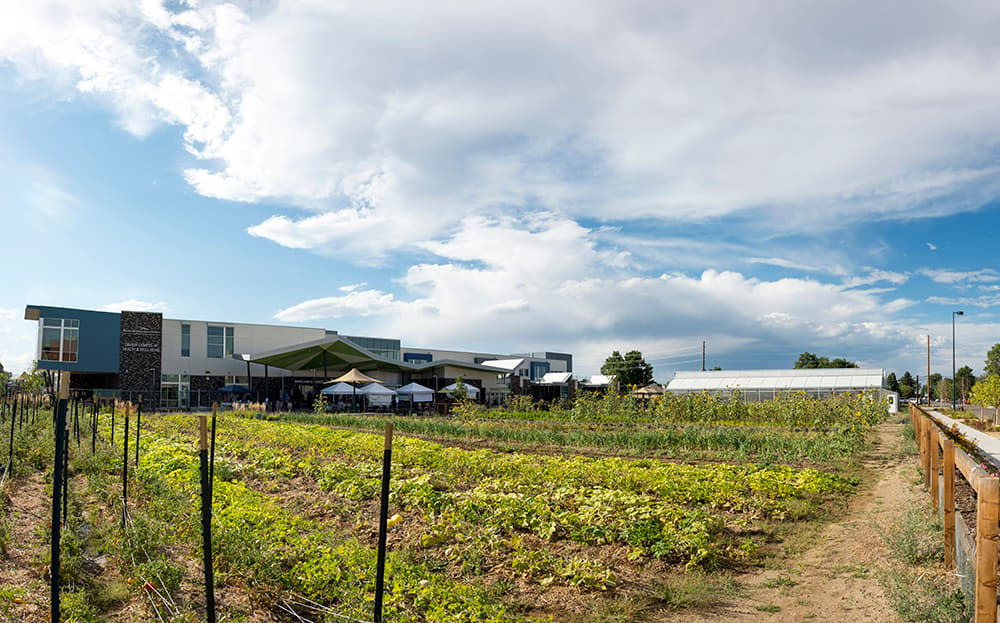
Displacement continues to be one of the "unintended consequences" that Huggins said resulted from DURA's history of blight-busting. But she said DURA has learned from the impacts of its past projects and has found new ways to address social and economic disparity without tearing down neighborhoods. The Dahlia Campus for Health and Well-Being, located in the official Northeast Park Hill statistical neighborhood, is an example of a DURA project that has served its existing community well. It was built to address a history of inequity and uplift locals without destroying their homes.
Elrick, the Berkeley urban planning scholar, said officials can't lose sight of the people their decisions impact. A fancy map is not a solution; it's merely a tool.
"There was a certain faith put into technicians and experts to solve these fundamentally political and social problems," he said of cities' early efforts to attack blight. "They thought they could model their way out of it, but what got lost were the voices of the people who were suffering, the people who were impacted."
Correction: Tracy Huggins' last name was originally misspelled in this story and this story was updated to reflect that Dennis Siglinger was fresh out of graduate school when he started working for the city.